Article
Why Ecosystem Design Controls Are Really About Moving Faster With the Right Rigor
This post was previously on the Pathfinder Software site. Pathfinder Software changed its name to Orthogonal in 2016. Read more.
Too often in software development projects, we’re asked to provide what I would call thoughtless reports. By this I mean a collection of tables and charts that depict and enumerate standard relationships. There’s nothing wrong with the reports themselves, mind you — we know how to present relationships in graphical form. No, the problem is that no one has given much thought to the relationships that are being depicted.
You’ve probably heard about the finding that in children, shoe sizes and handwriting quality are highly correlated. It would be wrong to conclude, however, that one causes the other. In fact, as children mature, their shoe size increases, as does their cognitive ability and their motor skills. They are all dependent on age.
That may seem obvious when we talk about shoes, but it may be less obvious when talking about sales or marketing figures. It may seem obvious to graph income versus purchases or conversions versus sales leads, but you may be visualizing the sales and marketing equivalents of shoe size and handwriting quality.
I suggest approaching the problem of data visualization in a more open minding fashion, like a scientist. Ask yourselves what questions you are trying to answer, and if you’re measuring or collecting the right information in your software system to answer those questions. Only when you have determined these two things will you be able to pick the right way or ways to visualize the correct relationships.
Let me give an example from my own experience. I used to work for an economist named Robert Fogel. His particular area of study was Economic History or Cliometrics. When I worked with him in the early 90’s, his focus was on the economics of morbidity and mortality, i.e. sickness and death. A big part of this study revolved around nutrition. One of the challenges was how best to study nutrition, especially when all that one had in historical records were weight and height.
The key insight, as expressed in Fogel’s 1993 Nobel Prize lecture was that:
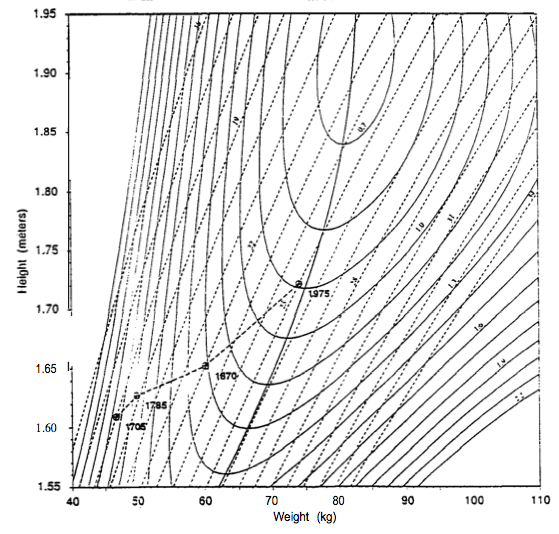
Height and BMI measure different aspects of malnutrition and health. Height is a net rather than a gross measure of nutrition. Moreover, al- though changes in height during the growing years are sensitive to current levels of nutrition, mean final height reflects the accumulated past nutritional experience of individuals throughout their growing years, including the fetal period. It follows that when final heights are used to explain differences in adult mortality rates, they reveal the effect, not of adult levels of nutrition on adult mortality rates, but of nutritional levels during infan- cy, childhood, and adolescence on adult mortality rates. A weight-for-height index, on the other hand, reflects primarily the current nutritional status. It is also a net measure in the sense that BMI reflects the balance between current intakes and the claims on those intakes.
(BMI stands for Body Mass Index, expressed as kg/m^2. Or weight normalized by height.)
Armed with this insight, Fogel could develop a method of data visualization (dubbed the Waaler Surface) that mapped height and weight versus risks of morbidity and mortality. This method was crucial to expressing many of the concepts and findings of this groundbreaking research.
Without careful thought about the relationships to be analyzed, however, this data visualization method would not have been developed, and discussions and writings about the topic would have been awkward and severely hampered.
So, the next time you are specifying reports and charts for your system, spare some thought on the nature and type of relationships you want to map.
Related Posts
Article
Why Ecosystem Design Controls Are Really About Moving Faster With the Right Rigor

Article
MedTech Teams Should Stop Paying for Compliance Twice

Article
Beyond the Device: Where MedTech Digital Ecosystems Are Starting to Pay Off

Article
Why MedTech Teams Slow Down as Software Grows and What Better Architecture Looks Like
