
Article
MedTech Teams Should Stop Paying for Compliance Twice

Since the introduction of the iPhone in 2007, iOS and Android smartphones have come to define and dominate the U.S. smartphone market, with approximately 81% of American adults owning a smartphone by 2019 and over 99% of those smartphones being either an iOS or Android phone.
As the following graph illustrates, since the iPhone essentially created this new market back in 2007, smartphone adoption rates rose to 25% of American adults by 2011 and 97% by February 2021.
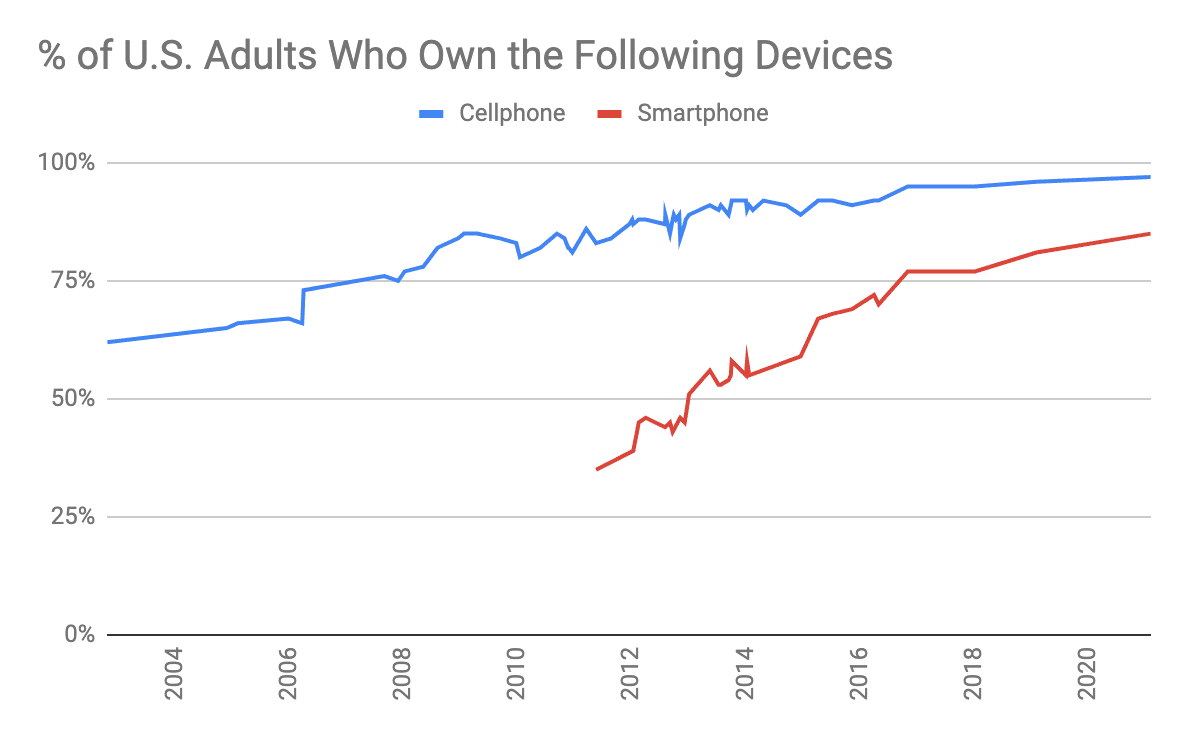
Chart 1. Percentage of U.S. adults who own cellphones and smartphones through 2021 (Source: Pew Research Center)
Taking advantage of the rapid and deep penetration of smartphones into the US consumer market, medical device manufacturers have been building increasingly sophisticated mobile medical applications, ranging from standalone Software as a Medical Device (SaMD) solutions such as digital therapeutics and insulin dosage recommendation applications, to smartphone applications that control Class III implanted medical devices.
Initially, many of these connected medical device solutions were provided together with a smartphone already paired to the medical device. Other connected medical device solutions were only supported on one or two smartphone models. In recent years, however, mobile medical solutions have been provided for download through app stores to the patients’ and clinicians’ personal smartphones that they already were using for work, communication, entertainment, and other medical purposes. This is often referred to as Bring Your Own Device (BYOD).
A BYOD approach to the distribution of SaMD software offers great convenience to users and a wide base of potential users to SaMD makers. However, a BYOD approach to regulated medical devices and their connecting software places additional demands on regulated medical device companies, as well as for the FDA and their regulatory counterparts in the EU and other countries.
During development, applications and their integrations need to be verified on different smartphones and operating systems — especially when implementing BYOD testing for mobile medical apps.
Once in-market, manufacturers often need to certify new operating systems and smartphones for compatibility with their software. With thousands of potential variants in the hands of consumers, this can be a substantial effort.
In a BYOD-based product environment, companies also need to determine which versions of Bluetooth and other evolving technologies they want to support and test across smartphones, operating systems (OS), and OS versions. This always entails trade-offs between providing great market coverage, and the additional time, effort, and risk entailed in the verification of platform compatibility testing.
Companies developing a smartphone strategy for connected medical devices must consider and balance a number of key considerations including:
In 2019, seeing a crucial information gap in the MedTech marketplace, Orthogonal began publishing this quarterly white paper. We compile, analyze, and synthesize many different sources of smartphone market data to help inform the decisions of our connected medical device customers related to market coverage, verification, and platform compatibility testing.
In each new edition of this white paper, we cover:
Where available, we include up to four years of historical data, so this latest report looks back as far as Q1 of 2017. Rather than looking at data about new smartphone sales, we primarily focus on the active subscriber base data for smartphones. The latter describes what devices are actually in use by consumers as a whole today. In contrast, trends in the buying of new phones can take several quarters to have a large impact on the overall market and the related decisions of medical device makers.
To develop and update this report, we compile data from several sources and cite them throughout the white paper. In many cases, there is no definitive data set to answer a certain question. In some cases, there are several different data sets that use different data collection methods that yield relatively close estimates. We’ve endeavored to compare these data sets and the data collection methodologies behind them, and then select the highest quality ones for our analysis.
Two operating systems that are used on over 99% of smartphones currently in use: iOS and Android. iOS is owned by Apple, while Android is a free and open platform (with some restrictions) that was developed and is maintained by Google. iOS can only run on Apple devices, while Android is found on a variety of smartphones and tablets from other leading brands, including Samsung, Google, LG, HTC, and Motorola, among others.
While the current dominance of iOS and Android was not assured in the early years of smartphone adoption, over the last seven years, iOS and Android have gone from a combined 78% share of the smartphone market to today’s overwhelming 99% share.
Android and IOS have roughly a 60%/40% split of the North American subscriber base, a change from equal in the past year. (Data sets provided by different analytics providers have fairly high variation in between their estimates for iOS and Android subscribers. Of these providers, Comscore has the largest data set and will be referenced most frequently.)
In contrast to North America, Android has a much larger share of the subscriber base than iOS in the rest of the world. In large part, this is due to the relative affordability of non-Apple smartphones compared to iPhone prices combined with the size of the “non-affluent” smartphone market globally.
iOS Versus Android Subscriber Base Share
As of January 2021, ComScore data shows that iOS subscriber base share covers approximately 52.40% of the U.S. market. (Other sources, such as StatCounter, cite up to 60%).
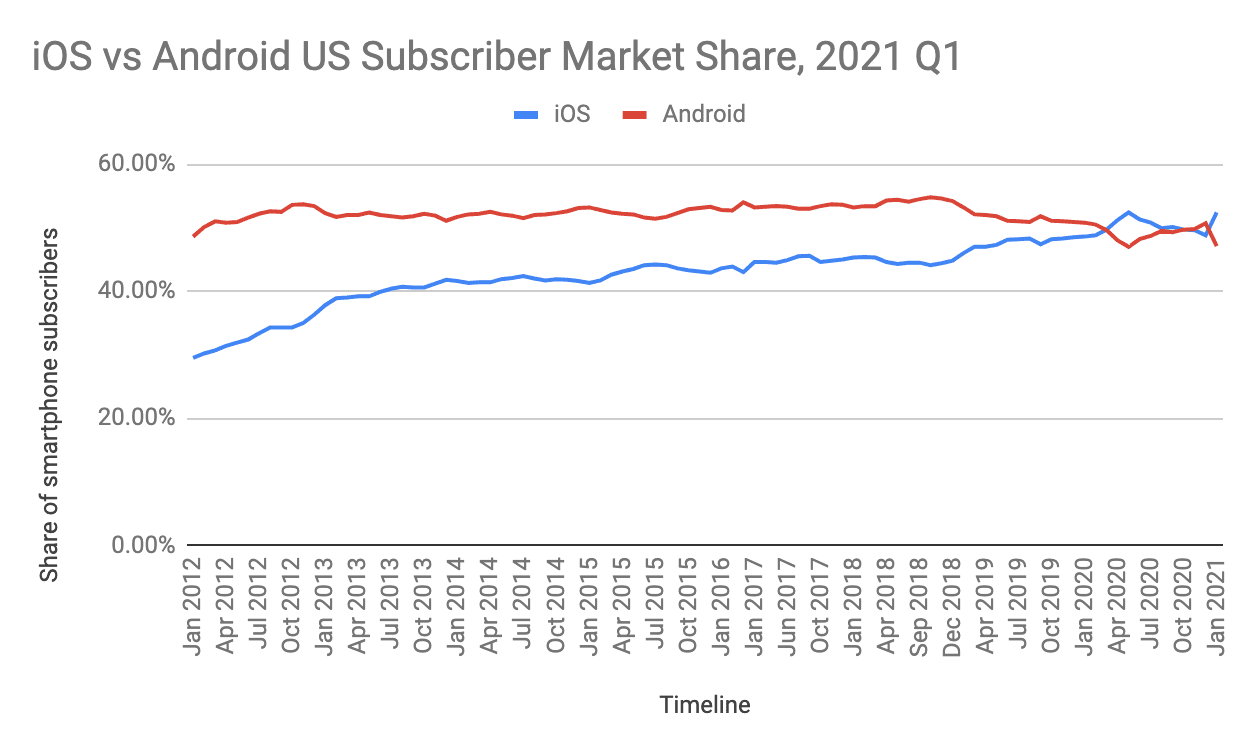
Chart 2. iOS versus Android U.S. subscriber base share, 2021 Q1 (Source: ComScore)
The data also shows that iOS has steadily increased its subscriber base share by about half a percent per month over the last seven years. This past year has seen iOS subscriber base share grow slightly faster.
Up until Q1 of 2020, iOS’ growth has been primarily at the expense of Blackberry and Microsoft’s mobile operating systems. However, with Blackberry and Microsoft currently commanding less than one percent of the overall subscriber base, iOS’ more recent growth in market share over the past year has been at the expense of Android. For iOS, there was a dip in in Q4 2020 between October to December 2020 but it climbed back up in January 2021. On the other hand, market share of Android has been slowly increasing starting January 2020 and overtook iOS market share in Q4 2020 but in Q1 2021, there was a slight drop in market share. August and December of 2020 but iOS was back up in January 2021 again. Android dipped in April 2020 and again in January 2021.
However, the last year’s data indicates that we could be entering a period where Android and iOS are essentially locked in a year-by-year competition to retain the leading US market position.
Feature Comparison
For the most part, both iOS and Android smartphone and operating system feature parallel each other: one platform adopts a new feature first, and the other follows suit with a later OS version or hardware introduction (usually within a cycle or two).
One area with important functional differences between the two platforms relevant for medical device companies lies in the management of health and fitness data. Currently, Apple’s HealthKit and ResearchKit are much richer and potentially more valuable to medical device makers than the competing Google Fit.
Closed Platform Versus Open Platform
Apple’s iOS platform is a closed platform with a forced OS upgrade path. In other words, Apple pushes its iPhone users to upgrade to the latest OS version via automatic updates.
On the other hand, the Android operating system is open source. Consequently, multiple smartphone manufacturers sell phones that run on the Android platform, and each manufacturer offers several different smartphone models at the same time. Almost all Android smartphone manufacturers (with the exception of Google) delay the implementation of Android OS updates by a number of months. In addition, many do not “force” upgrades like Apple does with iOS on iPhones. This results in significantly more versions of the Android OS in active use at any point in time than for iOS phones.
All the combinations of Android smartphones and OS versions add up quickly, creating thousands of variants. Therefore, the collective upgrade path for Android is much slower than that of iOS, due to all the variants which must be deployed every time there is an update to Google’s base Android OS software.
Android and iOS Subscriber Demographics
To determine which smartphones your SaMD should support, it’s important to look at the smartphone ownership demographics of your medical device’s potential user base, because they may not necessarily mirror the broader North American statistics.
Unfortunately, while Pew Research provides demographic information on smartphones, there is relatively little open data available on comparative demographics between iOS and Android. In terms of the age of iOS and Android, the data tends to show a roughly even distribution between iOS and Android for those over 55 years old.
We’ll discuss and break down more key differences between iOS and Android, focusing on their subscriber base share.
% of U.S. Adults Owning the Following Devices in 2021
| Any cellphone | Smartphone | Cellphone, but not smartphone | |
|---|---|---|---|
| Total | 96% | 81% | 15% |
| Men | 98% | 84% | 14% |
| Women | 95% | 79% | 16% |
| Age 18-19 | 99% | 96% | 4% |
| 30-49 | 99% | 92% | 6% |
| 50-64 | 95% | 79% | 17% |
| 65+ | 91% | 53% | 39% |
| White | 96% | 82% | 14% |
| Black | 98% | 80% | 17% |
| Hispanic | 96% | 79% | 17% |
| Less than high school graduate | 92% | 66% | 25% |
| High school graduate | 96% | 72% | 24% |
| Some college | 96% | 85% | 11% |
| College graduate | 98% | 91% | 7% |
| Less than $30,000 | 95% | 71% | 23% |
| $30,000-$49,999 | 96% | 78% | 18% |
| $50,000-$74,999 | 98% | 90% | 8% |
| $75,000+ | 100% | 95% | 5% |
| Urban | 97% | 83% | 13% |
| Suburban | 96% | 83% | 13% |
| Rural | 95% | 71% | 24% |
Table 1. Percentage of U.S. adults who own the following devices. (Source: Pew Research Center survey, conducted Jan. 25 to Feb. 8, 2021)
[maxbutton id=”13″ ]
Headquartered in Cupertino, California, Apple is the world’s leader in smartphones. In the first quarter of 2021, Apple announced they hit their highest quarterly revenue ever, at $111.4 billion. Apple represented approximately 53.4% of the overall subscriber base in the United States (see Chart 3 below), equal to the combined subscriber base of all of the Android smartphone manufacturers.
The company boasts both more affordable models, such as the iPhone SE, as well as higher-priced premium smartphones, such as the iPhone 12 Pro Max. The Apple operating system, iOS, runs on the company’s iPhone, iPad, and iPod touch devices — and, until recently, on Apple Watch, which now has a related OS, Watch OS.

Chart 3. Smartphone vendor subscriber base share in the U.S., Q1 2021 (Source: Comscore)
The Latest
In October of 2020, Apple released four new models of iPhone, namely iPhone 12, 12 Mini, 12 Pro, and 12 Pro Max. In April 2020, Apple also released the second generation of iPhone SE. In 2019, Apple also released three new phones — the iPhone 11 , 11 Pro, and 11 Pro Max — bringing the total number of hardware models released by the company to 28. These new phones join a diverse portfolio of recent Apple smartphone offerings, including the iPhone SE.
Additionally, Apple also sells certified refurbished models, including the iPhone 8, and X, the iPhones XS, and XS Max, and the iPhones 11, 11 Pro, and 11 Pro Max. Currently, Back Market is the only third-party retailer selling certified refurbished iPhones.
Recent Trends
Over the past three years till 2019, Apple has been releasing about three new phones per year, typically in September. However, in 2020, Apple released a total of 5 new phone models. Many iPhone models (five specific models across both the iPhone 5 and iPhone 6 generations) were phased out in 2016. By contrast, fewer were pulled off the market in 2017 (just one — the 256GB iPhone 7) and four in 2018. On September 2019, Apple discontinued four new models: the iPhone 7, iPhone 7 Plus, iPhone XS, and iPhone XS Max. On April 15, 2020, the iPhone 8 and 8 Plus were discontinued when Apple launched iPhone SE 2020, a successor to the iPhone SE launched in 2016. In October 2020, Apple discontinued the iPhone 11 Pro and iPhone 11 Pro Max.
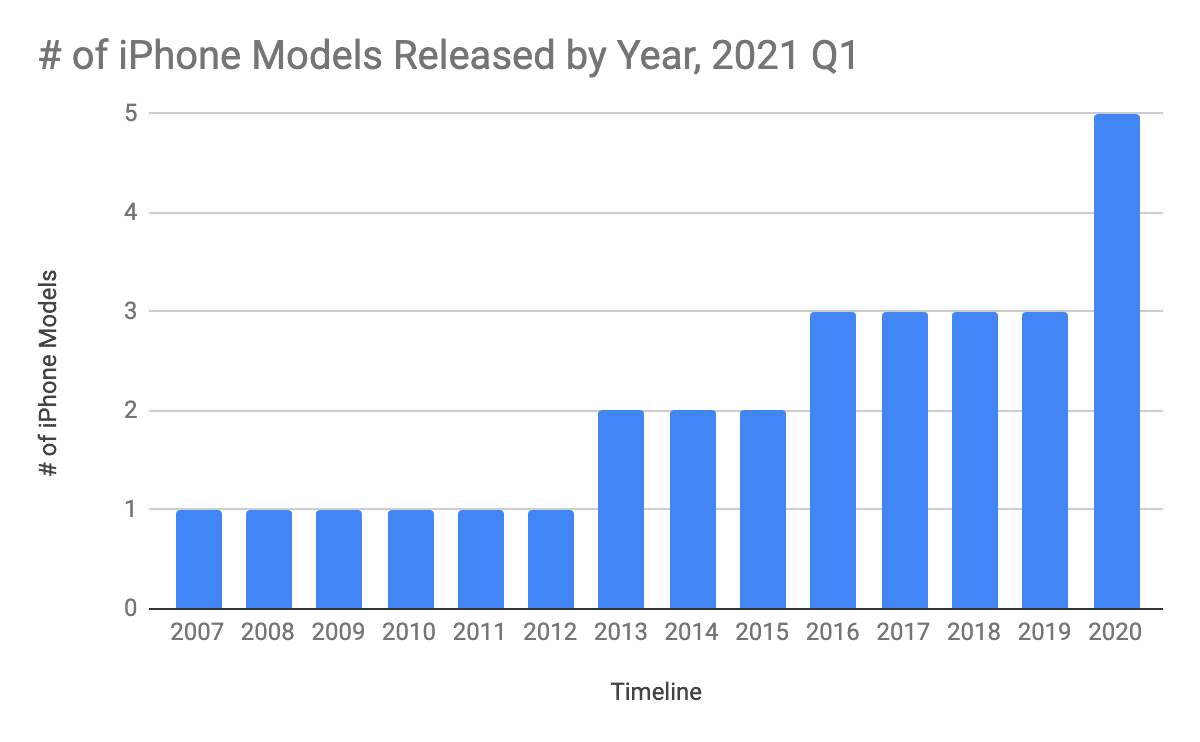
Chart 4. Number of iPhone models released by year through Q1 2021 (Source: Apple)
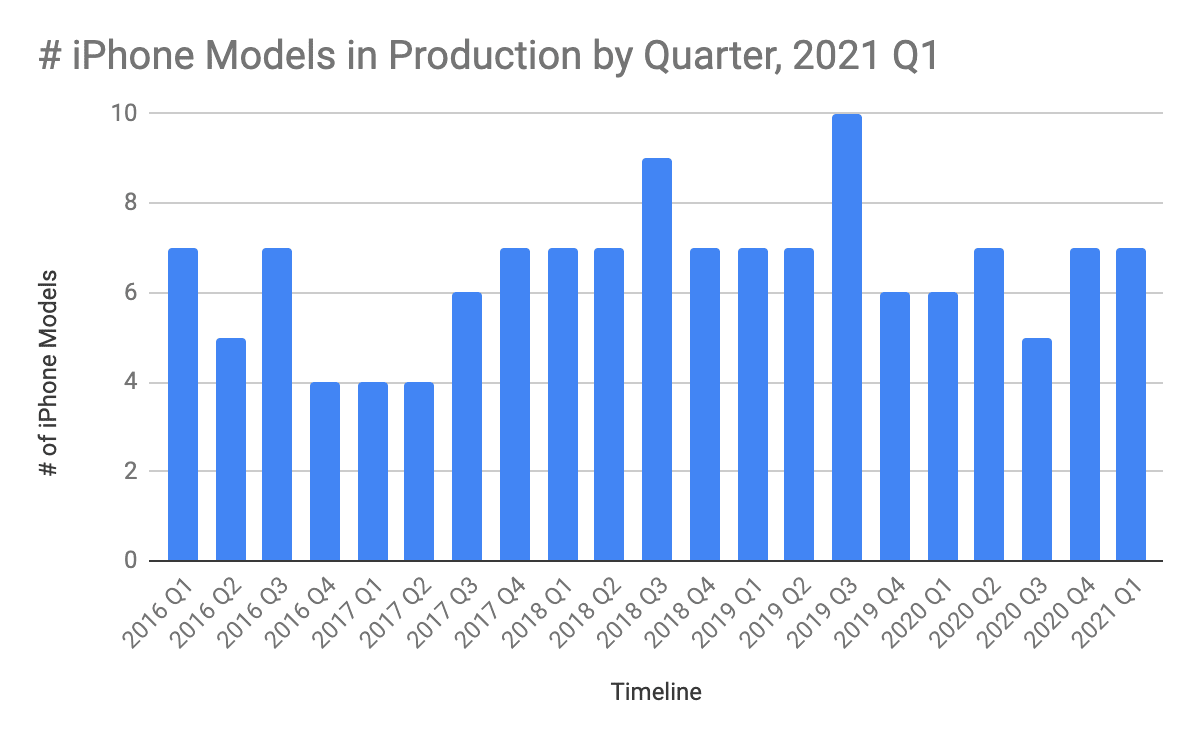
Chart 5. Number of iPhones in production by year through Q1, 2021 (Source: Websites of U.S. smartphone manufacturers)
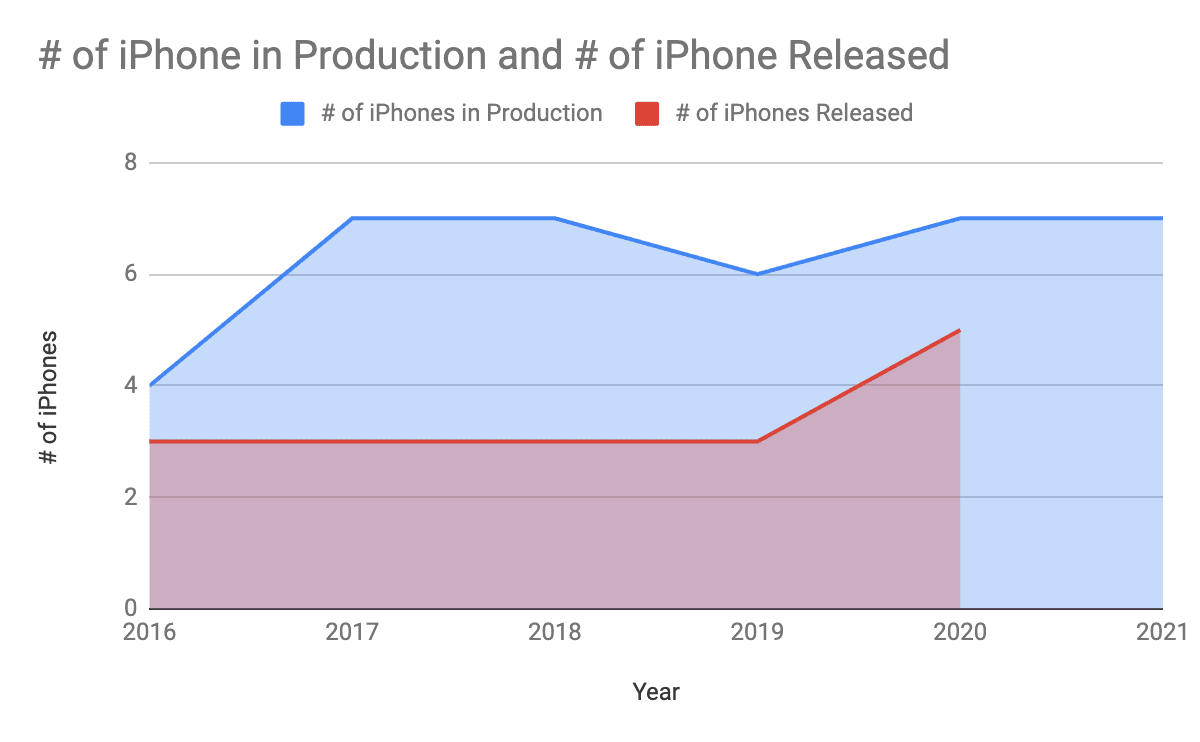
Chart 6. Number of iPhones in production and number of new iPhones released through Q1 2021 (Source: Apple.com)
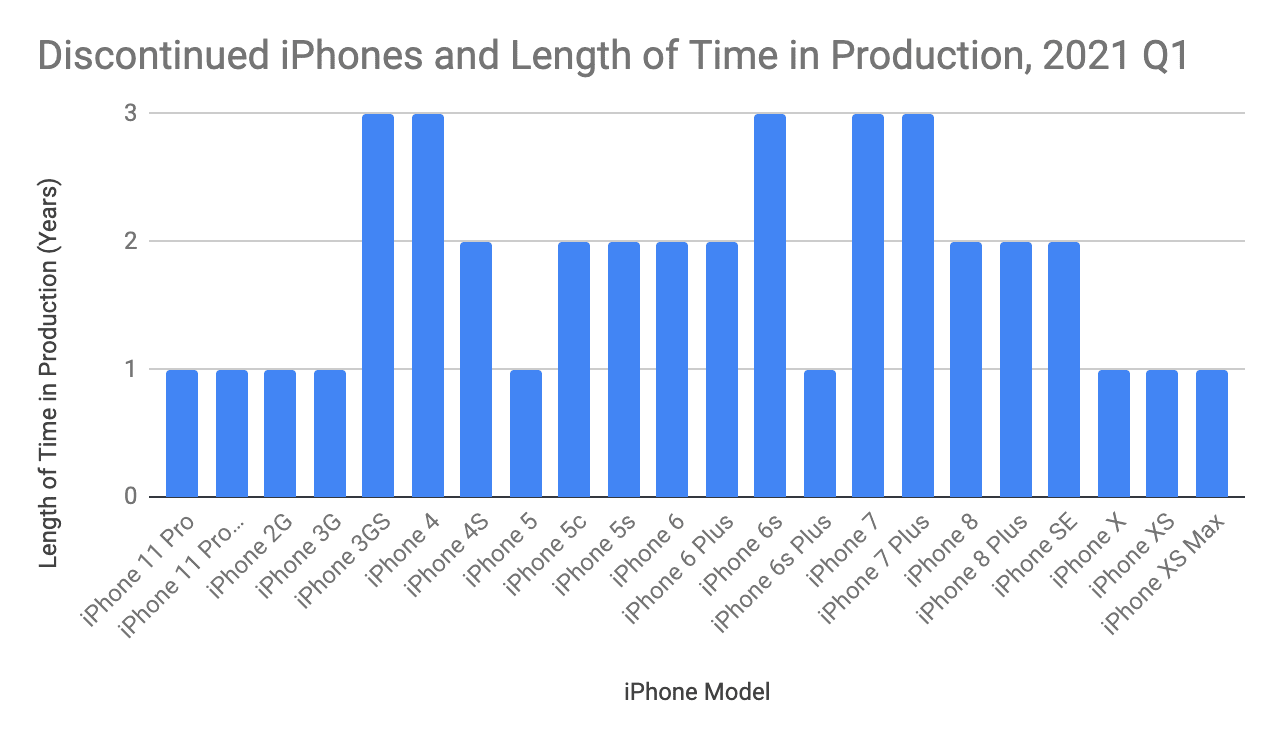
Chart 7. Discontinued iPhones and the length of time in production through Q1 2021 (Source: Apple.com)
Insights
The iPhone 12 models have a longer battery life and come with 5G service, along with upgraded cameras. There are 4 iPhone 12 models, the iPhone 12 mini, iPhone 12, 12 Pro, and 12 Pro Max, compared to the three iPhone 11 models. Similar to the iPhone 11 models, the iPhone 12 continues to have a telephoto lens, wide-angle lens, and ultra wide-angle lens to autofocus pictures and the ability to produce sharper images especially in low light settings. For mobile medical apps utilizing the smartphone camera, these upgraded lens capabilities may add additional functional possibilities, along with more complexity, software updates, and testing for existing applications.
The new iPhone 12 models come with the A14 Bionic processor, improving the browsing and camera experience as well as increasing the capacity for the iPhone to handle future iOS versions. In design, the iPhone 12 has an OLED display compared to the 11’s LCD. It also has a magnetic backing, a more durable screen, and no raised buttons.
One feature which bears watching in the future is the new U1 chip, included in all of the new iPhones. This new chip enables Ultra-Wideband (UWB), which can pinpoint location with 30cm accuracy — much better than Bluetooth. It can also use “time of flight” to determine location, measuring how long it takes for a radio wave to pass between two objects (when compared to Bluetooth, this can improve security by preventing relay attacks). Additionally, UWB passes through walls and human bodies safely and easily, and can transfer data at up to 8mbps, which is up to four times faster than Bluetooth 5.0. BLE.
While superior to Bluetooth, the U1 chips are also more expensive, and there are currently no UWB smartphone peripherals. However, Apple’s support for the feature may lead to the creation of new smartphone peripherals that support UWB.
Finally, Apple’s trade-in service which started back in 2013 was a strategic move that should serve to remove older iPhones from circulation and incentivize the purchasing of its newest models. Apple allows you to trade in your eligible device for credit towards your next purchase, or get an Apple Gift Card. They send their customers a trade-in kit and a shipping label to send it off making it super easy.
Insights
Apple has had a relatively consistent two- to three-year life cycle for its smartphones, with upgrades partially driven by the typical two-year mobile operator contract, as well as the OS upgrade cycle and its planned obsolescence. We don’t expect major changes to this dynamic.
As shown earlier in Chart 7, discontinued iPhones can spend anywhere from less than one year to up to three years in active use. While discontinued iPhones are no longer sold, in most cases they can still be used and upgraded to the newest iOS. However, this capability is ultimately phased out for discontinued iPhones due to planned obsolescence and the company’s forced upgrade path.
Other models, also shown in Chart 7, were either discontinued or rendered obsolete due to software upgrades from iOS 10 (the prevailing software in 2016) to the current software, iOS 14.
If you currently have smartphone applications in the market with a user base that includes iPhone 8 or earlier versions, you’ll need to determine a strategy for managing this user base: either continue to support these phones and the older operating systems they run on or force an upgrade to newer phones and operating systems.
The former potentially exposes you to additional cybersecurity risks and other maintenance and support issues, while the latter risks alienating certain users.
The higher the IEC 623041 software safety classification of the medical device maker’s smartphone application, the higher the level of concern about the connected device(s), and the more we would recommend forcing smartphone and operating system upgrades.
The Latest
Apple offers increased functionality and bug fixes with each new iteration of its iOS software, which forms the operating system running on all iPhone smartphones. iOS 14 released on September 2020, is the latest as well as the most popular version, currently commanding about 87.95% of the subscriber base share. iOS 13, which was released in 2019, holds 8.17% of the subscriber base share, iOS 12, which was released in 2018, holds 3.34% of the subscriber base share, and iOS 11 makes up 0.56% of the subscriber base share (Chart 8).
Recent Trends
iOS 14 is one of Apple’s largest update to date introducing a new Home screen, major new features, updates for existing apps, Siri improvements and many other tweaks that streamline the iOS interface.
We are already seeing that iOS 13 is slowing being phased out by iOS 14. Apple releases a new iOS each year, typically in conjunction with (or slightly thereafter) the release of its latest iPhone models. This matters for developers and product managers, who must stay up to date with the most recent iOS innovations.
Though the new iOS 14 will rapidly replace iOS 13 for most users, users of iPhones that cannot be upgraded to iOS 14 may choose to keep using iOS 13 on their phones, rather than upgrade to a new model. Therefore, it is difficult to predict precisely what the iOS share will be in the future — just that newer models will increasingly dominate the iOS market as older versions become obsolete.
Still, the tendency is for users to upgrade to the most recent iOS, and as of Q1 2021, older versions of the operating system — that is, iOS 6 through iOS 13 — comprise about 12% of the market.
Insights
One effect of Apple’s iOS update system is that some older devices are effectively phased out if they are not supported by a major OS release. For example, iOS 13 is not supported on the discontinued iPhone 7, essentially spelling the death of this particular model. Users may continue to use the iPhone 7 without updating it but will start seeing limited functionality relative to users of newer iPhone models.
Companies may wish to consider an iterative update format to complement the iOS update to provide compatibility for a wide range of devices, both old and new. As we highlighted earlier, a new iOS is typically launched each year, and Apple’s forced upgrade path means that every two- or three-years certain iPhone models are rendered obsolete, forcing users to upgrade or stay with their old phone.
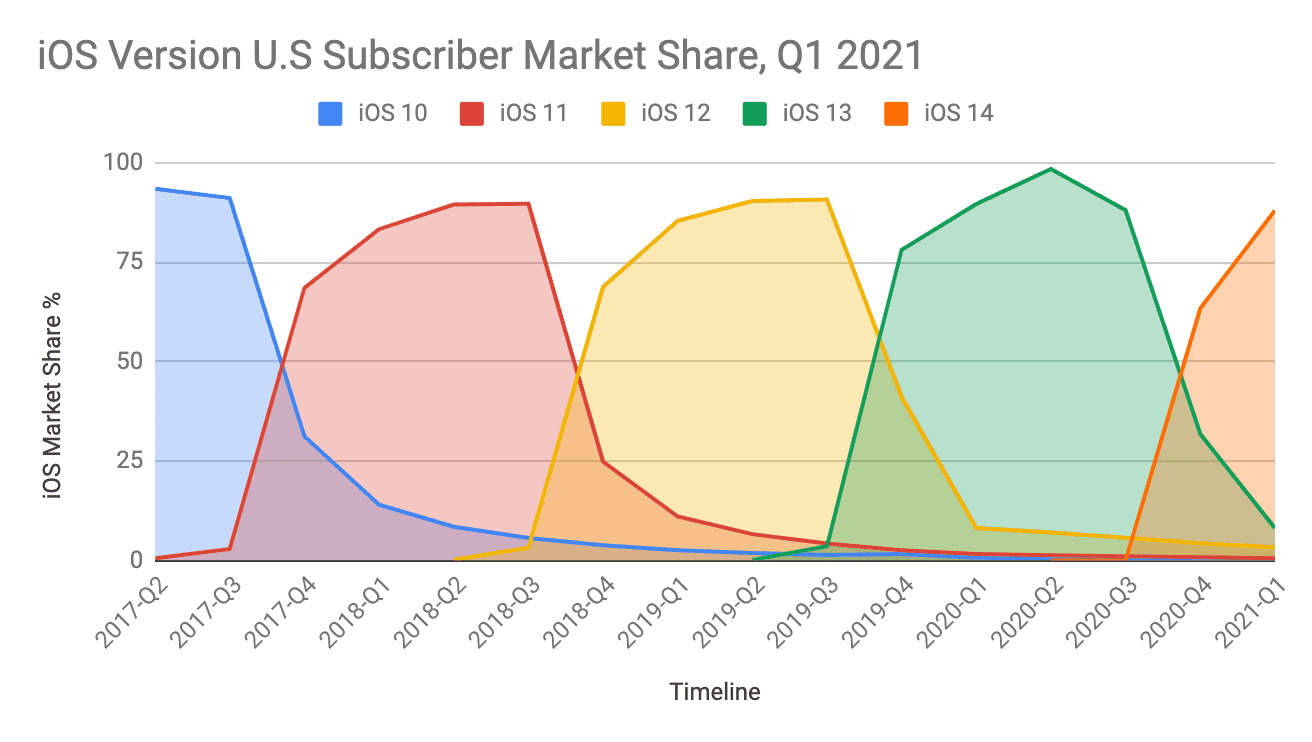
Chart 8. iOS version U.S. subscriber base share, Q1 2021 (Source: GlobalStats)
The iOS Beta Program
For each new full iOS version, iOS beta 1 is typically released in conjunction with a “first look” at the Apple Worldwide Developer Conference (WWDC) in early June; a beta 2 is launched for developers a few weeks later; a public beta often one or two weeks after that; and a series of developer and public betas thereafter. A golden master is released to developers about two weeks before full public launch. While changes to the beta typically decrease significantly with later beta versions, it is possible to have UI changes in the beta until fairly late in the cycle.
As a medical device software developer, you should start doing an initial analysis of the OS changes and a dry run test of your software as soon as the first beta comes out. Depending on your software’s associated patient risk, it is prudent to ensure that the software cannot run on the public beta in production, while providing sufficient labeling (i.e., warnings) to users of this fact.
iOS Version Point Upgrades
Apple typically releases several minor upgrades to each major iOS version, with an average of 12.5 updates annually in recent years. Minor upgrades are meant to address bugs, make minor system improvements, and occasionally add new features.
Chart 9 shows that iOS 13 had 17 minor version upgrades, currently highest minor updates to a major version and iOS 14 has 8 minor version updates so far, with the most recent one as 14.4.2, as of March 2021. iOS 12 had seen 12 minor updates and iOS 11 had 16.
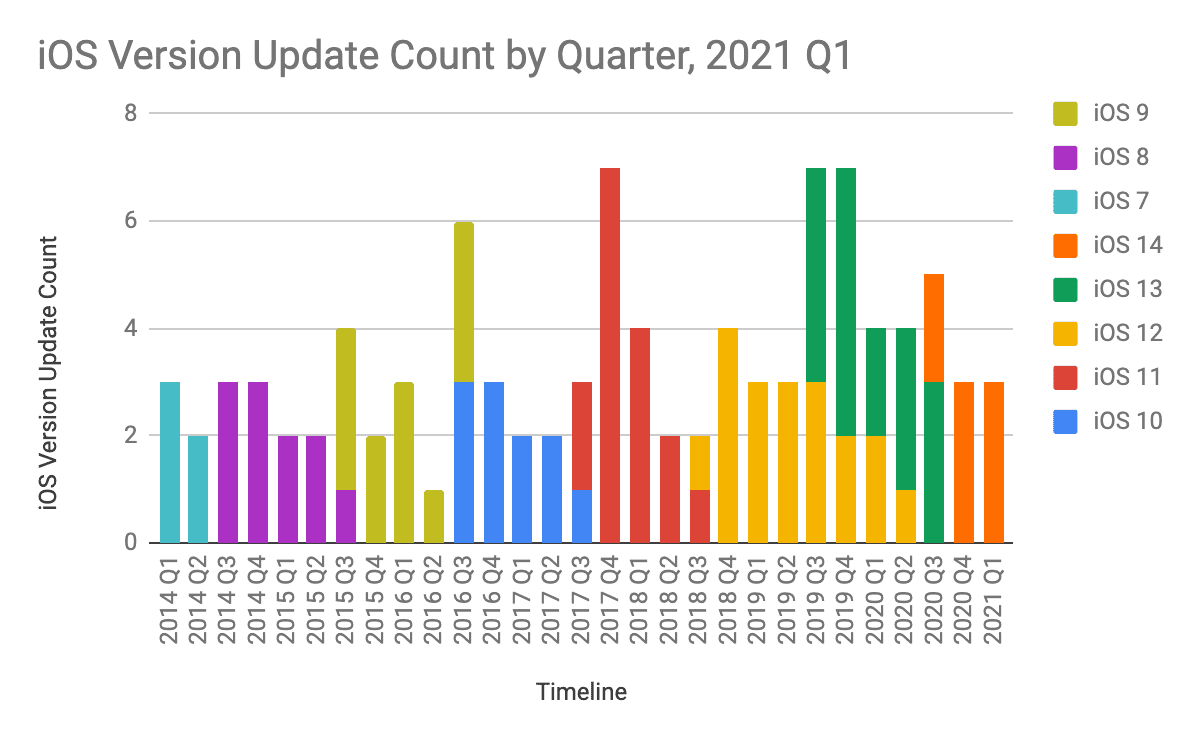
Chart 9. iOS version update count by quarter as of 2021 Q1(Source: Apple.com)
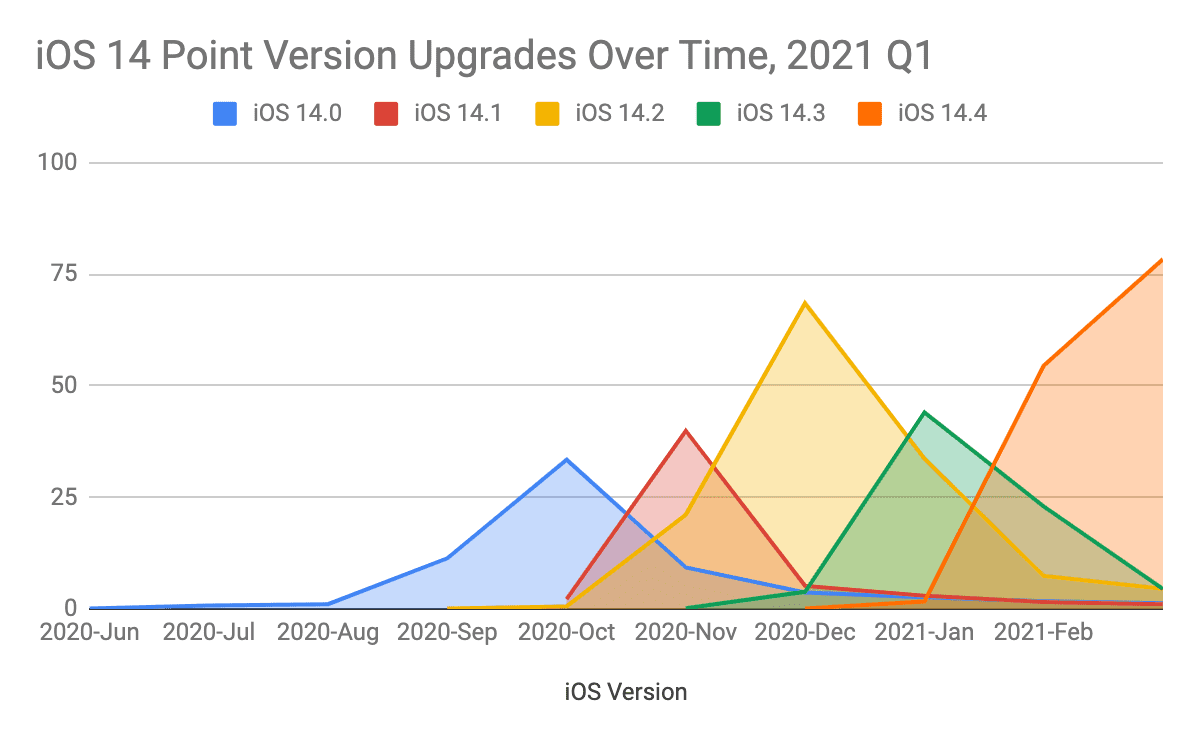
Chart 10. iOS 14-point version upgrades over time through Q1 2021 (Source: GlobalStats)
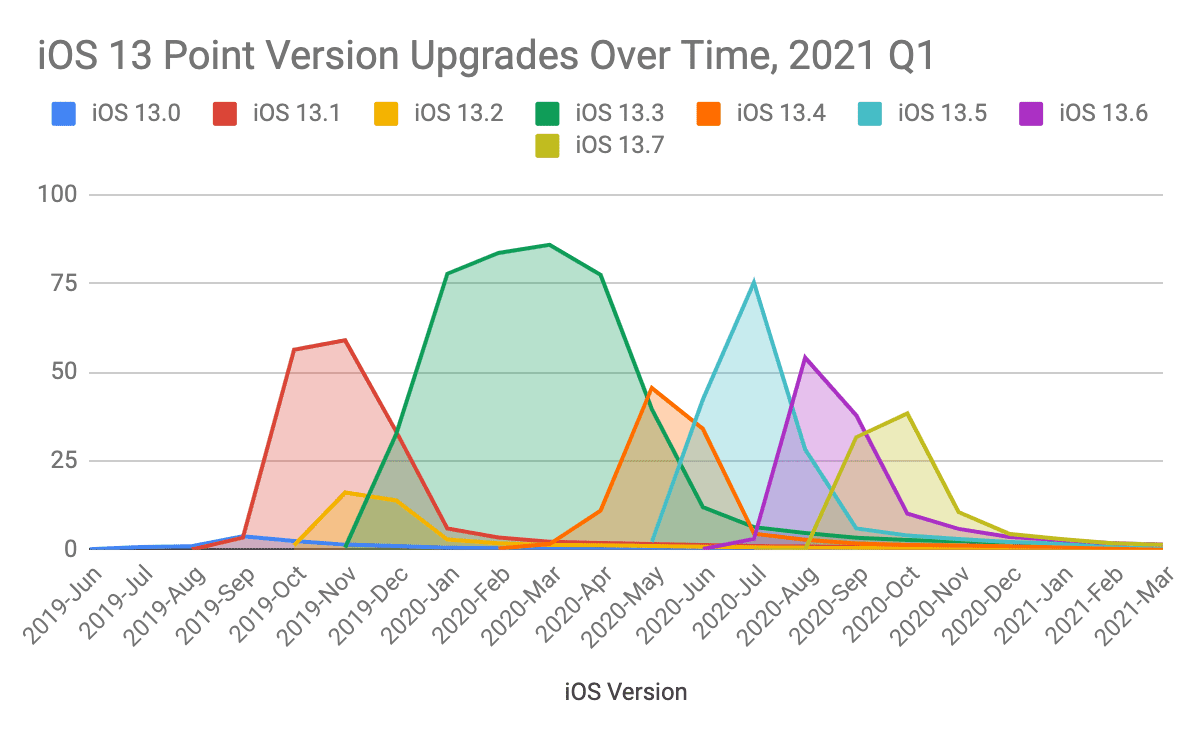
Chart 11. iOS 13-point version upgrades over time through Q1 2021 (Source: GlobalStats)
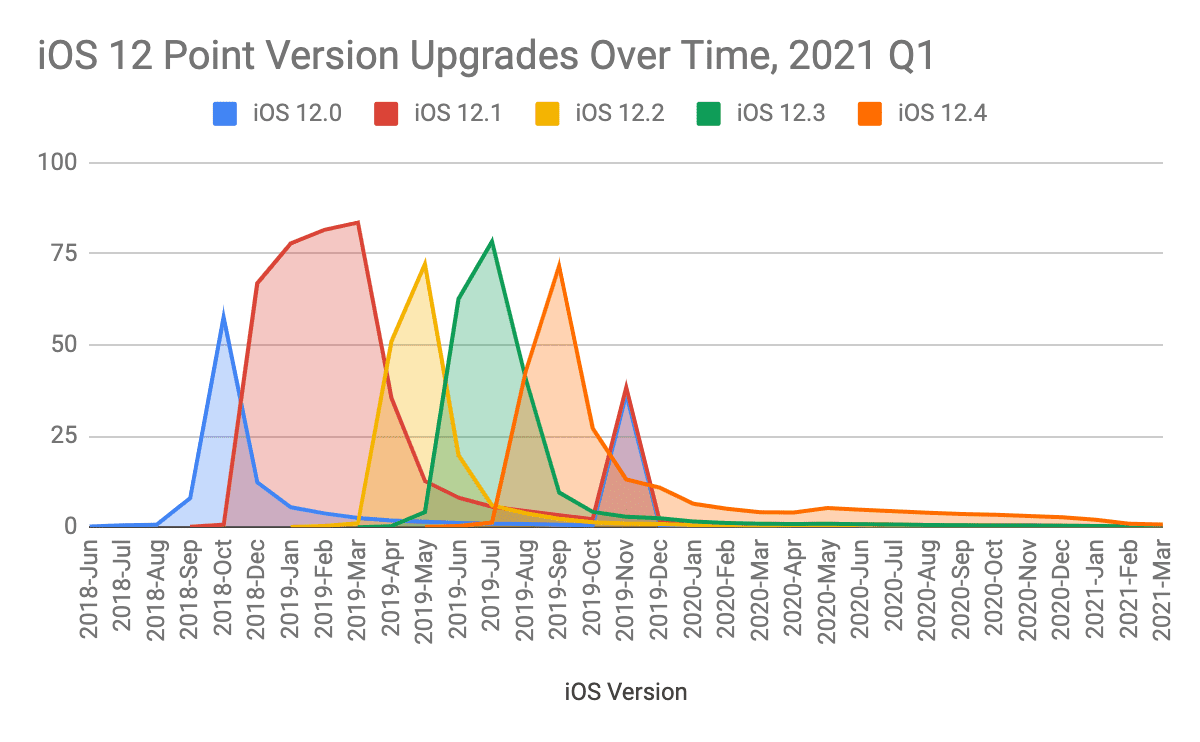
Chart 12. iOS 12-point version upgrades over time through Q1 2021 (Source: GlobalStats)
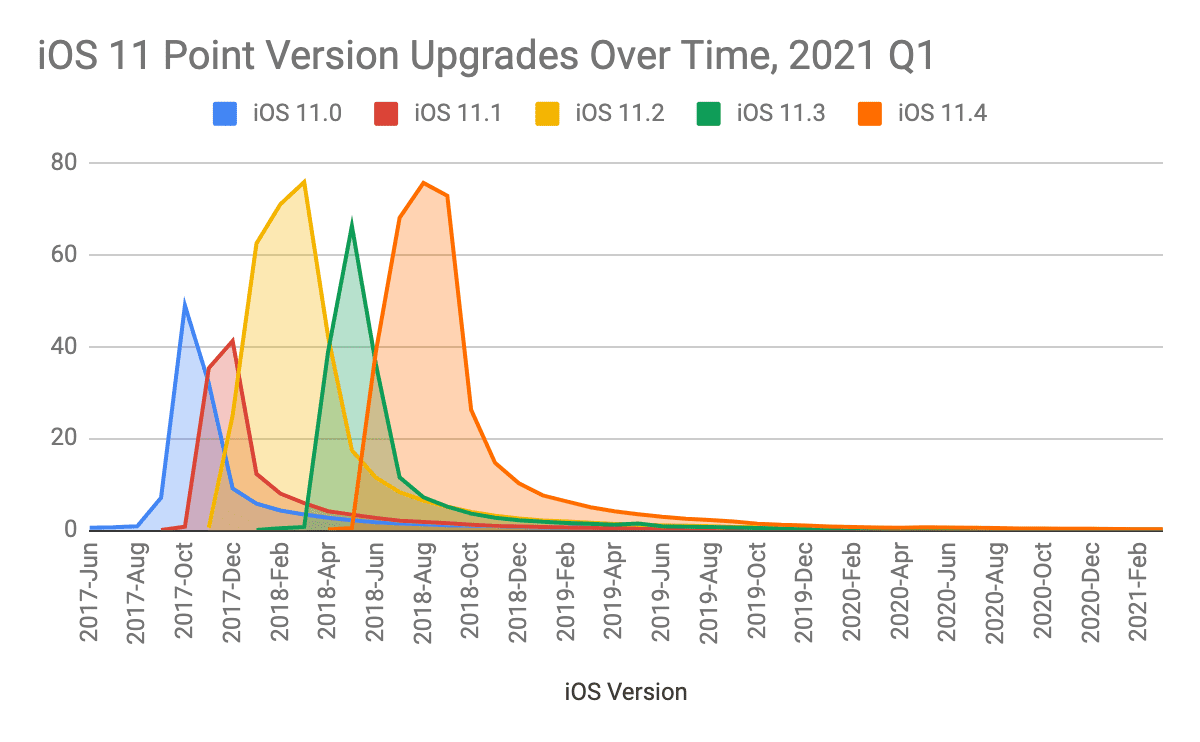 Chart 13. iOS 11-point version upgrades over time through Q1 2021 (Source: GlobalStats)
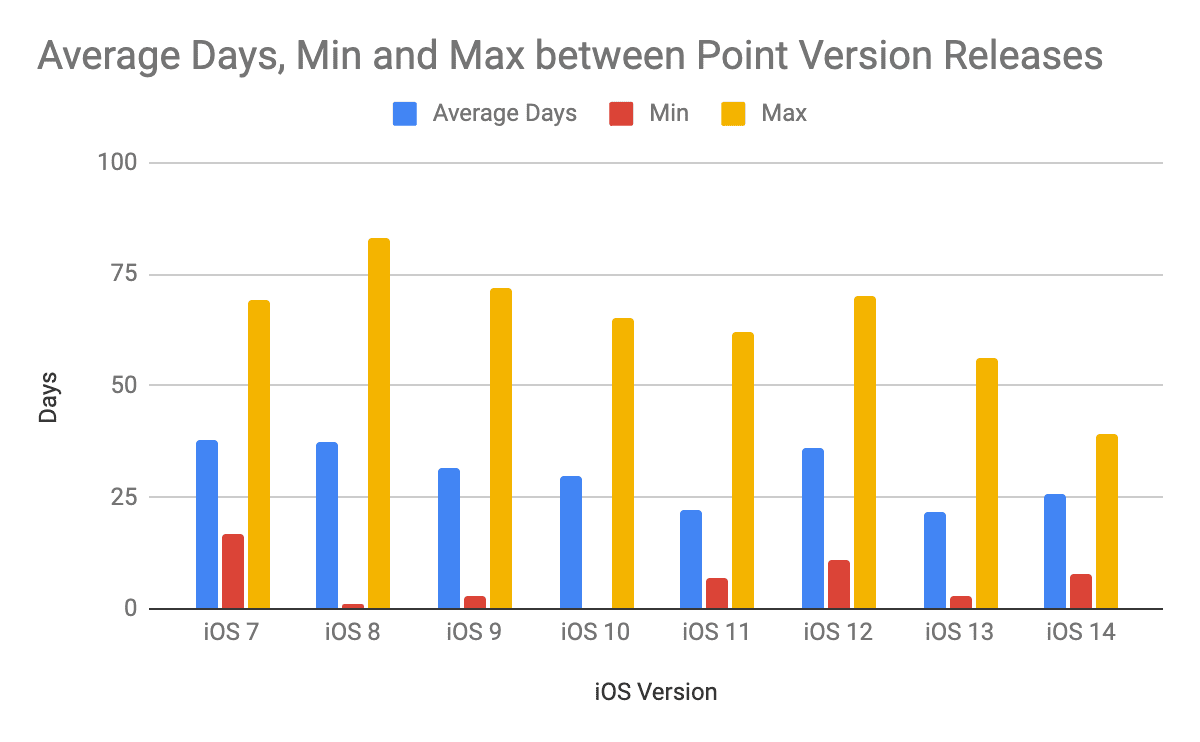
Chart 14. Minimum, maximum, and average days between point version releases (Source: GlobalStats)
The average time between point version releases is just under 30 days, with the shortest time between releases coming in at zero days when Apple released versions 10.0 and 10.0.1 on the same day.
[maxbutton id=”13″ ]
Android is a smartphone operating system developed, operated, and maintained by Google. Based on a modified version of the Linux kernel, Android is an open-source operating system meant to run on touchscreen mobile devices such as smartphones and tablets.
As the primary competitor to Apple iOS, Android is used by 47.1% of smartphone subscribers in the U.S., according to ComScore. Globally, Android has a much larger subscriber base share, with over 2.5 billion global users compared to approximately 900 million global iPhone users).
A defining difference between Android and iOS is that multiple manufacturers — including Google, Samsung, LG, Motorola, and HTC in the U.S., and Huawei and Xiaomi in China — use the Android OS, giving consumers freedom and flexibility when choosing their device. iOS, on the other hand, is exclusive to Apple devices.
Android’s appeal lies in the fact that it can be used on a variety of devices and integrated with users’ Google platforms (such as Google Maps and Gmail) for a powerful, unified computing experience across smartphones, tablets, and personal computers. Other noteworthy Android features include affordability, long battery life, easy customization, voice assistance, and cloud backup storage via Google Cloud.
While the flexibility afforded by all the different Android smartphone manufacturers is a benefit to consumers, it also makes the upgrade path for Android devices manufacturers more complex. Each Android manufacturer offers many different smartphone models which each require separate Android upgrades. Most manufacturers lag behind Google when it comes to the availability of Android OS versions, and there is no forced upgrade path. As a result of these factors, there can be several thousand smartphone models to consider when deploying a BYOD strategy.
The Latest
While a large number of smartphone manufacturers worldwide sell Android-based phones, four manufacturers sell the vast majority of Android phones in North America: Samsung, LG, Motorola, and Google (which all follow Apple in subscriber base share in Chart 16).
You’ll notice that Chart 15 and Chart 16 highlight roughly the same data. Chart 15, representative of ComScore data, shows that in February 2021, Apple held 52.8% subscriber base share, Samsung 25.7%, LG 6.2%, and Motorola 4.1%. The subscriber share of HTC has slowly been declining.
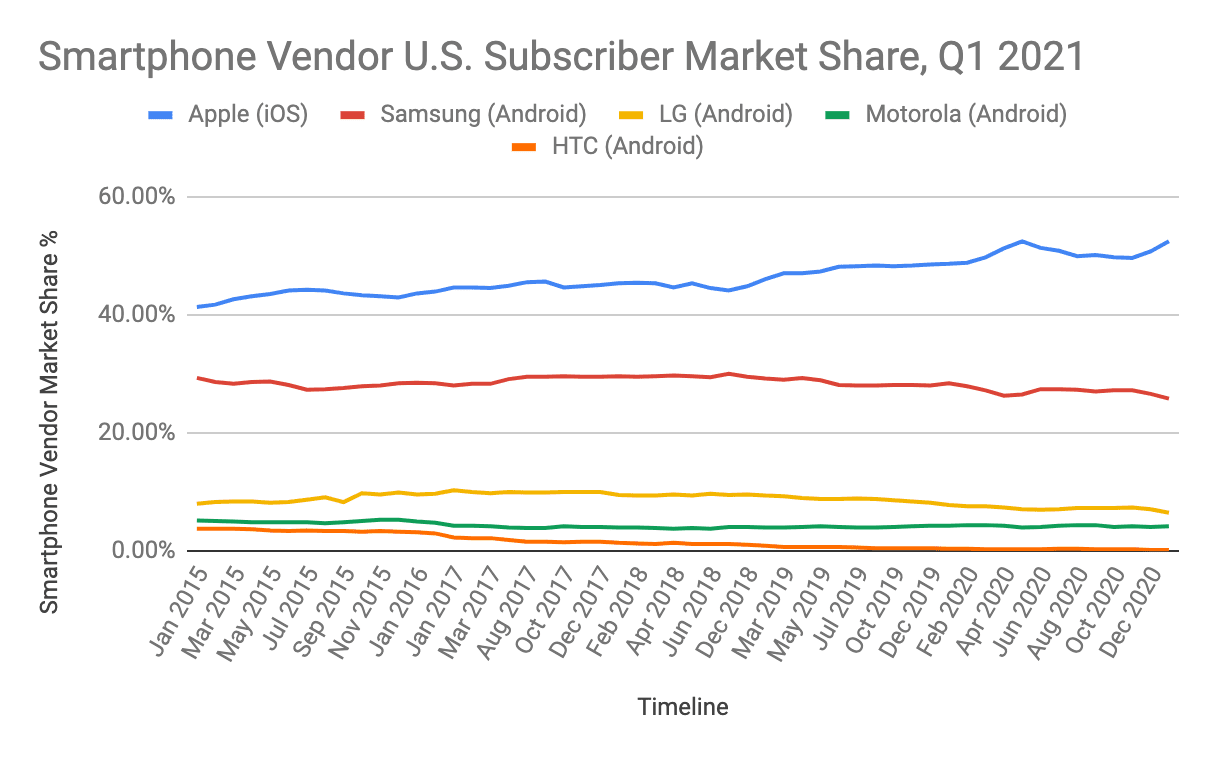
Chart 15. Smartphone vendor subscriber base share in the U.S., Q1 2021 (Source: ComScore)
While comprehensive, ComScore data does not include Google. However, because Google has become a large player on the smartphone scene over the last few years, especially when compared to HTC, we included data from StatCounter to reflect this growth (Chart 16).
Stat Counter’s data, based on web usage, shows that Google has slowly but steadily been increasing its subscriber base share, and as of Q1 2021, occupies 2.36% of the market.
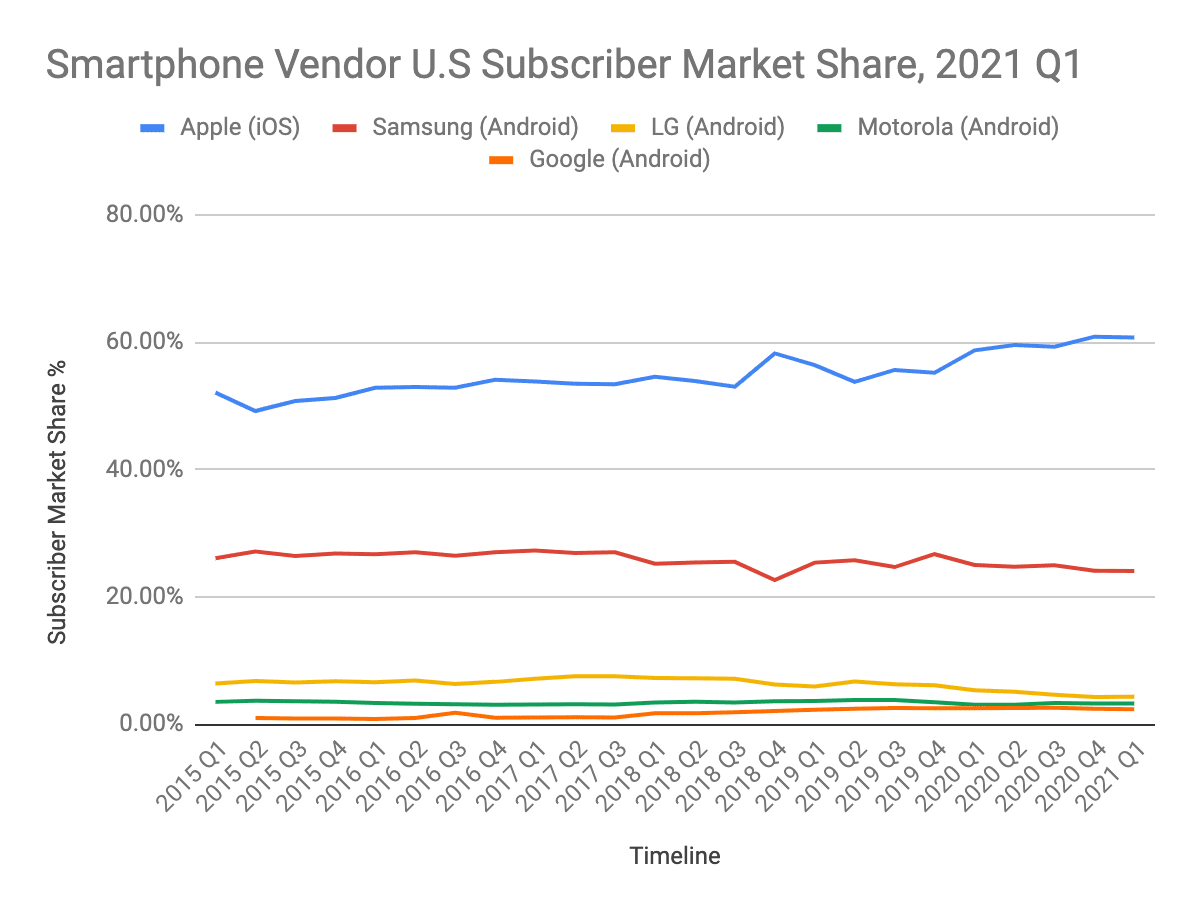
Chart 16. Smartphone vendor subscriber base share in the U.S., Q1 2021 (Source: StatCounter)
Recent Trends
Despite periodic fluctuations, both data sets show a relatively consistent trend in subscriber base share for the major Android brands. Google, as the originator of the Android OS, occupies a much smaller percentage of the market than one might expect.
Recent data also shows that both Apple and Samsung have gained more subscriber base share (Chart 16), followed by LG, then Motorola, and Google.
Insights
Smartphone sales in the United States are primarily mobile operator driven. While it is possible to buy smartphones from vendors other than mobile operators, even Apple, which sells smartphones through its site and Apple stores, only sells about 10% of its phones this way (although this may change as a result of Apple’s aggressive trade-in program). This has resulted in a high level of stability in the market.
Still, there are a couple of ways in which this can shift. In 2016, Google only sells through one mobile operator in the U.S. — Verizon. Starting 2019, Google added the Pixels to T-Mobile, Sprint, and US cellular. Due to more mobile operators carrying Google’s Pixel phones, Google’s share has been steadily increasing. And if other vendors that have a high subscriber base share in Asia can strike deals with mobile operators in the U.S., there will likely be a shift as well (albeit a slow one).
The Latest
Q1 2021 has been productive two quarters so far for the largest Android smartphone manufacturers:
Recent Trends
2020 was also a dynamic year for Android smartphone manufacturers, ushering in new products which run the Android 11 OS in Q3 2020:
Insights
In addition to ongoing trends such as the ever-increasing processing power of RAM and storage, a few new ones have emerged among the recent (and upcoming) releases: more cameras (including tri-camera and quad-camera phones), more AI (especially around image processing), and, despite some initial hiccups, foldable phones.
Foldable phones present a new form factor and potential new use cases, as they may end up being used by both tablets and smartphones alike.
For SaMD and Connected Mobile Medical Device (CMMD) manufacturers looking to utilize smartphone cameras, additional cameras and the use of AI for image processing can be a double-edged sword: they offer more power, but also rely more on OS level image processing, which may require additional testing and/or workarounds, should image processing play an important role in functionality with a higher safety classification.
The FDA is only in the exploratory stages of developing policies around updates to machine learning based algorithms, and while the outline of a policy for continuous learning algorithms is starting to emerge, it is unlikely that this will apply to the use of third party algorithms in consumer smartphones. If you are using algorithms that take images from smartphone cameras as inputs, we recommend using raw images and implementing your own locked algorithms.
The Latest
Currently, Samsung has 34 models in production for the U.S. market, Google has 3 models, LG has 73 models and Motorola has 22 models (Chart 17).
Looking at the number of new models released per year, Samsung averages around 27 models per year, LG about 51 models per year, Motorola around 17 models per year, and Google releases 3 new models per year (Chart 18).
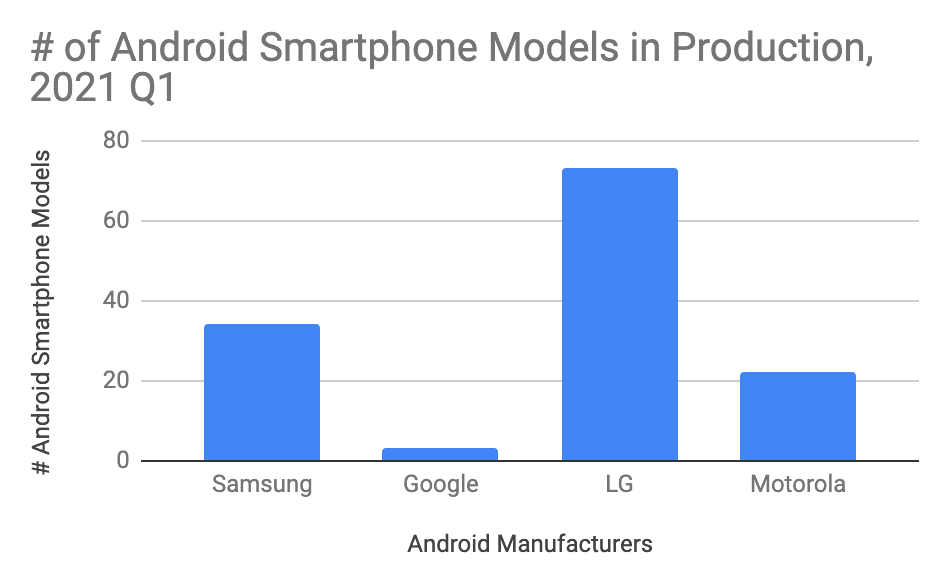
Chart 17. Android smartphone models in production through Q1 2021. (Source: Websites of smartphone manufacturers)
Insights
Given the typical two- to three-year life cycle per phone, the number of Android smartphone models in use in the United States ranges somewhere between 120 and 180 models.
While subscriber data from different sources shows that certain models are more popular than others, and that new models have a higher popularity overall, the market is still highly fragmented, with the top 10 models having a combined share of 18% of the total Android market and around 9% of the total smartphone market.
This makes getting to 90% of the market on the Android side much more difficult than on the iOS side.
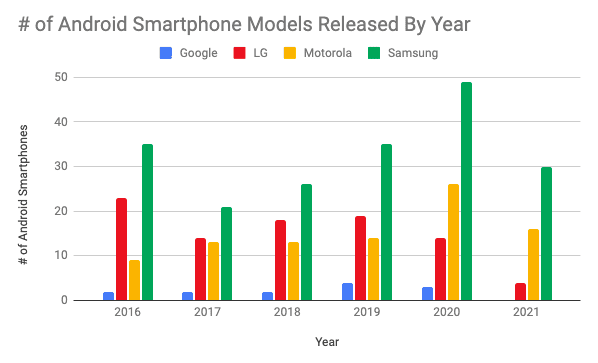
Chart 18. Number of Android smartphone models released by year through Q1 2021 (Source: Gsmarena)
Background
Android released its first commercial OS version, 1.0, on September 23, 2008. Since then, the OS has been continually developed by Google and the Open Handset Alliance.™ Each update has traditionally been named after a dessert until the 10th version of OS, which became known as Android 10.
Android 11 was released on September 8, 2020, Android 10 was released on September 3, 2019 and Android 9 or “Pie” on August 6, 2018. Android 8, or “Oreo,” was released on August 21, 2017.
As of Q1 2021, the OS versions with the largest subscriber base share were: Android 10 “10.0” (40.52%), Android 11 “11.0” (21.01%), Android 9 “Pie” (19.76%) followed by Android 8 “Oreo” (4.9%) and Android 7 “Nougat,” (2.54%).
Android 10 also marked a shift in how Google named its OS versions. The company recently acknowledged that while fun, their current approach (i.e., naming OS versions after desserts) isn’t necessarily accessible to all users. They believe that “this change helps make release names simpler and more intuitive for [the] global community.”
As with iOS, Android continually makes minor updates to its OS in-between versions, often released every few months. This means one can expect any given version of Android to undergo several point upgrades throughout its life cycle.
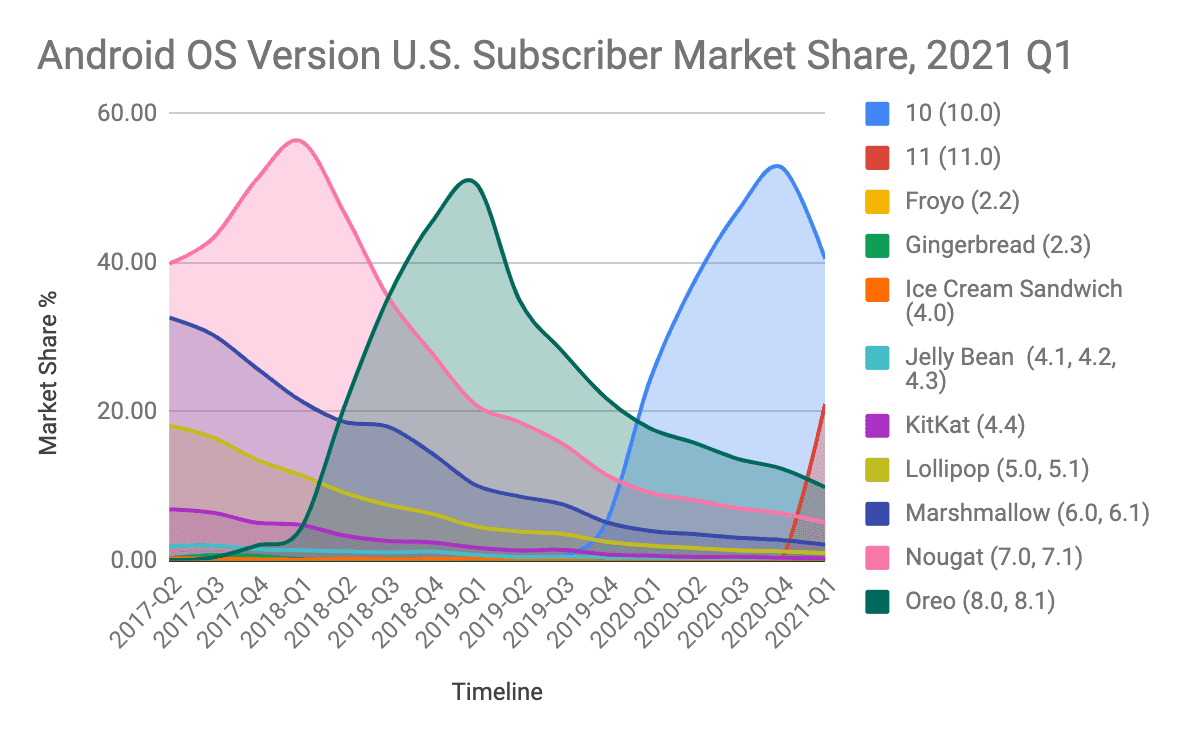
Chart 19. Android OS version U.S. subscriber base share through Q1 2021 (Source: GlobalStats)
Trends
The OS version life cycle is longer for Android than for iOS, typically between two and three years. This pattern holds for most Android smartphone brands. The only exception to this among the four major Android brands in the U.S. — Samsung, LG, Motorola, and Google — is the Google Pixel phones, which typically undergo planned obsolescence in terms of both hardware and software.
Because Google Pixel phones are owned by Android, as soon as Android releases a new OS version, Pixel is the first to adopt it. This means that its life cycle, at approximately two years, is the shortest among Android devices, and comparable to the product life cycle of Apple iPhones.
Insights: Manufacturer Android Updates Lag Behind Google
One of the challenges for manufacturers using Android is that in order to implement the latest version, they need to modify the lower-level hardware code that interacts with the higher level AOSP operating system code. Before Android 8 Oreo, no formal vendor interfaces existed, so manufacturers had to update large portions of the Android code base with each update, and often needed updates from the system on a chip (SoC) as well.
Google rearchitected Android for Oreo and later versions with Project Treble, establishing a modular base of hardware abstraction layers (HALs) that formalize the divisions between hardware subsystems and the client on the software side, with interfaces specified in hardware interface definition language (HIDL). This should make OS upgrades substantially easier for manufacturers going forward.
Unfortunately, the Oreo upgrade proved to be one of the worst performing upgrades to date by device makers, taking an average of 208 days for the upgrade to reach the flagship of non-Google phones (Chart 20). The Android 9 Pie upgrade performed even worse, with an average of 220 days for non-Google phones. However, international device makers including Nokia, OnePlus, Sony, Vivo, and Essential saw a better performance, averaging only 96 days. These makers were also able to enroll smartphones in the Android Beta Program, which allows users to test drive and provide feedback on pre-released versions of an Android OS before the official version is released to the public.
In Q4 2020, both Samsung and LG joined the international device makers in the Android 10 Beta Program. As a result, we saw significantly shorter upgrade time for Samsung and LG for Android 10 compared to Android Pie (Chart 20).
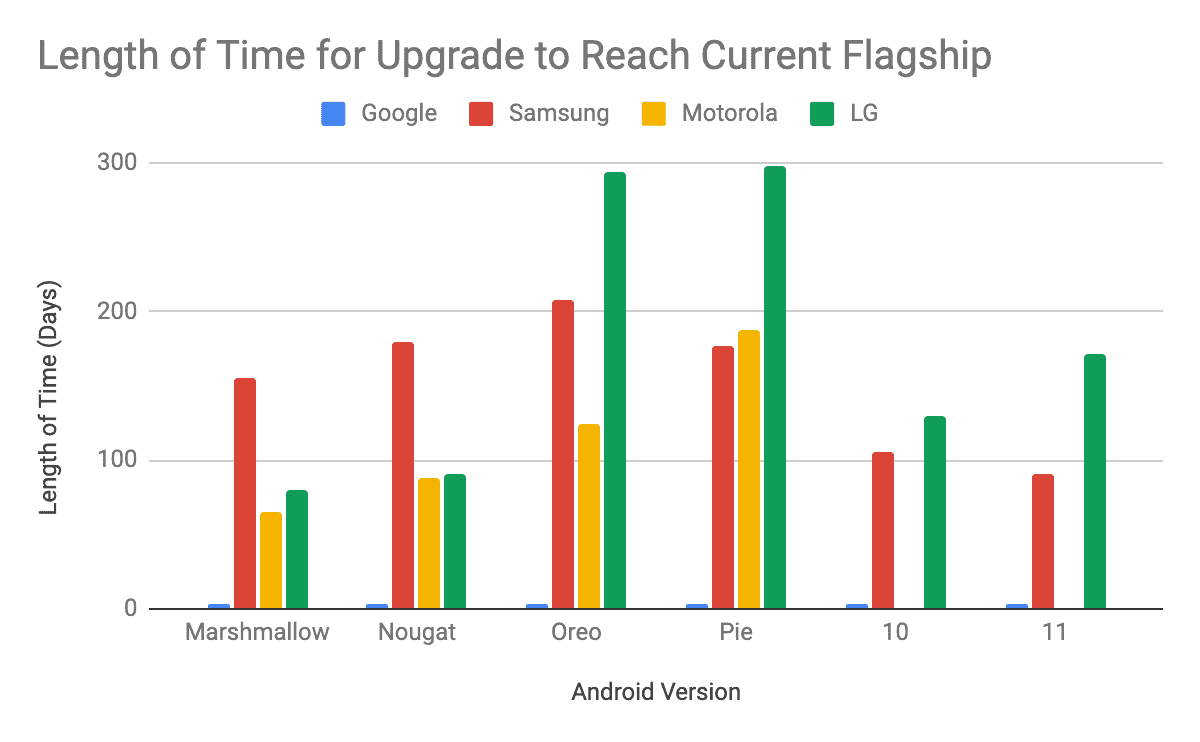
Chart 20. Length of time for upgrades to reach current flagship (Source: Computer World)
Form factors such as screen resolution, screen size, and pixel density should play a role in your development strategy. Especially for Android, the large variety of phones means that you will likely need to adapt your product to a multitude of screen parameters.
Apple
Apple continues to innovate in the design of their smartphones. The company launches larger-screen smartphones boasting more powerful features each year. In 2018, the most popular iPhone model was the iPhone 7, followed in second place by the larger-screen iPhone X (which has since been discontinued in favor of the similarly-sized XS), as well as the larger screen XR and XS Max models.
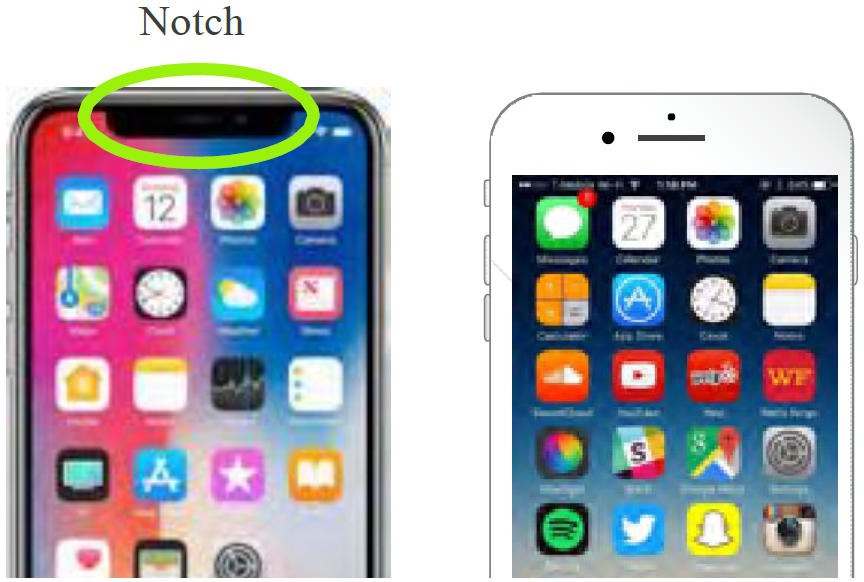
With the iPhone X, Apple introduced a fuller screen with a notch, which added additional design considerations. The notch has been continued in the iPhone XS, XR, 11, and 12 models.
Android
The unfortunate truth is that not all Android hardware models’ form factors are extensively well-characterized in terms of subscriber base, due to the high level of competition within the Android space and numerous companies offering multiple hardware models.
However, you should be aware of screen size, screen resolution, and pixel density in order to ensure the best user experience possible. Incompatibility in visual parameters such as these can affect the usability of your SaMD product by making text and graphics harder to read or interact with on the smartphone screen.
And, similar to the most recent Apple models, Android manufacturers have also begun incorporating the (in)famous notch into the design of their new mobile operating systems.
By looking at the major players in the Android space, one can get an idea of significant parameters to anticipate. Although there is a multitude of hardware models running Android, the smartphones leading in subscriber base all currently belong to the Samsung Galaxy line of smartphones (S8, S9 and S10).
Insights
More and more, consumers are opting for bigger screens with better visual display characteristics — and both iOS and Android smartphone manufacturers are taking note. Large-screen smartphones and phablets (such as Samsung’s Note series) are capturing more of the subscriber base, though not yet taking the top spot.
Still, consumers are not abandoning smaller smartphone screens and resolutions, but some of these are being phased out by hardware manufacturers in favor of larger screens with an improved visual experience.
While increasing in popularity, larger screens are not likely to replace the more conventionally sized screens of existing smartphones, which still remain popular — that is, unless manufacturers continue the trend of phasing out smaller-screen mobile devices in favor of more powerful large-screen smartphones.
Finally, it’s worth a second mention that foldable phones are gradually making their way onto the market. New OS versions like Android 10 have been developed with this trend in mind. While the data is insufficient, we’ll keep monitoring for important new developments.
Screen Size, Resolution, and Pixel Density by Vendor
| iPhone | Screen Size | Screen Resolution | Pixel Density |
|---|---|---|---|
| iPhone 8 | 4.7 in | 1334 x 750 | 326 ppi |
| iPhone 8 Plus | 5.5 in | 1920 x 1080 | 401 ppi |
| iPhone X | 5.5 in | 2436 x 1125 | 458 ppi |
| iPhone XR | 6.1 in | 1792 x 828 | 326 ppi |
| iPhone XS | 5.8 in | 2436 x 1125 | 458 ppi |
| iPhone XS Max | 6.5 in | 2688 x 1242 | 458 ppi |
| iPhone 11 | 6.1 in | 1792 x 828 | 326 ppi |
| iPhone 11 Pro | 5.8 in | 2436 x 1125 | 458 ppi |
| iPhone 11 Pro Max | 6.5 in | 2688 x 1242 | 458 ppi |
| iPhone 12 | 6.1 in | 1170 x 2532 | 460 ppi |
| iPhone 12 mini | 5.4 in | 1080 x 2340 | 476 ppi |
| iPhone 12 Pro | 6.1 in | 1170 x 2532 | 460 ppi |
| iPhone 12 Pro Max | 6.7 in | 1284 x 2778 | 458 ppi |
Table 2. Apple screen size, resolution, and pixel density (Source: Apple)
| Samsung | Screen Size | Screen Resolution | Pixel Density |
|---|---|---|---|
| Samsung Galaxy S9 | 5.8 in | 2220 x 1080 | 570 ppi |
| Samsung Galaxy S9+ | 6.2 in | 2960 x 1440 | 529 ppi |
| Samsung Galaxy S10 | 6.1 in | 3040 x 1440 | 550 ppi |
| Samsung Galaxy S10+ | 6.4 in | 3040 x 1440 | 522 ppi |
| Samsung Galaxy S10e | 5.8 in | 2280 x 1080 | 438 ppi |
| Samsung Galaxy S20 | 6.2 in | 3220 x 1440 | 563 ppi |
| Samsung Galaxy S20+ | 6.7 in | 3200 x 1440 | 525 ppi |
Table 3. Samsung screen size, resolution, and pixel density (Source: Samsung)
| Motorola | Screen Size | Screen Resolution | Pixel Density |
|---|---|---|---|
| Motorola E5 | 5.7 in | 720 x 1440 | 282 ppi |
| Motorola G6 | 5.7 in | 2160 x 1080 | 424 ppi |
| Motorola G7 | 6.2 in | 2770 x 1080 | 403 ppi |
| Motorola Z3 | 6.0 in | 2160 x 1080 | 402 ppi |
| Motorola Z4 | 6.4 in | 2340 x 1080 | 403 ppi |
Table 4. Motorola screen size, resolution, and pixel density (Source: Motorola)
| LG | Screen Size | Screen Resolution | Pixel Density |
|---|---|---|---|
| LG G5 | 5.3 in | 2560 x 1440 | 554 ppi |
| LG G6 | 5.7 in | 2880 x 1440 | 565 ppi |
| LG G8 ThinQ | 6.1 in | 3120 x 1440 | 564 ppi |
| LG V35 ThinQ | 6.0 in | 2880 x 1440 | 537 ppi |
| LG V40 ThinQ | 6.4 in | 3120 x 1440 | 537 ppi |
| LG V50 ThinQ | 6.4 in | 3120 x 1440 | 538 ppi |
Table 5. LG screen size, resolution, and pixel density (Source: LG)
| Screen Size | Screen Resolution | Pixel Density | |
|---|---|---|---|
| Google Pixel 3 | 5.5 in | 2280 x 1080 | 443 ppi |
| Google Pixel 3 XL | 6.3 in | 2960 x 1440 | 523 ppi |
| Google Pixel 3a | 5.6 in | 2220 x 1080 | 441 ppi |
| Google Pixel 3a XL | 6.0 in | 2160 x 1080 | 402 ppi |
Table 6. Google screen size, resolution, and pixel density (Source: Google Store)
From audio streaming, into data transfer, to location services, all the way to device networks, Bluetooth technology is meeting the needs of the market. Many people do not recognize how often Bluetooth is used with their smartphones. With nearly 3.5 billion smartphones in the US, 100% of these devices are supported by Bluetooth.
There are currently two Bluetooth versions available for Android and iOS devices: Bluetooth 4.2 and Bluetooth 5.0.
As a technology, Bluetooth 5.0 has several advantages over Bluetooth 4.2. This includes improved coexistence with Wi-Fi devices, a 2x increase in transmission speed, a 4x increase in range, an 8x boost in broadcast messaging capacity, lower energy consumption leading to longer battery life.
According to ScientiaMobile’s MOVR report, as of Q1 2021, Bluetooth 5.0 covers approximately 72% of the iOS market share and Bluetooth 4.2 and earlier covers approximately 27% of the iOS market share. We expect Bluetooth 5.0 to comprise of 95% of the iPhone market by the end of 2022 (Q4 2022).
On the Android side, the most popular Bluetooth version is also the 5.0 which covers approximately 56%, followed by Bluetooth 4.2 which covers about 24% of Android market. From 2018 to 2021, there was an increase of Bluetooth 5.0 from 18% to 56% among Android devices. On average, there is a 3% per quarter increase in Bluetooth 5.0 support on the Android side, as older models get replaced with the newer ones. We expect Bluetooth 5.0 to comprise of 80% of the Android market by the end of 2022 (Q4 2022).
Given this information, many SaMD manufacturers are asking when they will be able to only develop devices and applications that support Bluetooth 5.0 (and be able to stop supporting Bluetooth 4.2) without sacrificing meaningful market share as a consequence. Ultimately this is a question that comes down to exactly how much market share are these medical manufacturers prepared to forego to lighten their Bluetooth 4.2 legacy investment and allow 100% of their users to take advantage of the additional benefits of Bluetooth 5.0.
Launched in December 2014, Bluetooth 4.2 introduced the IPv6 protocol, the most recent version of the Internet Protocol, for direct internet connection.
Version 4.2 supports both Bluetooth Classic and Bluetooth Low Energy (BLE). Bluetooth Classic is used to connect mobile phones to Bluetooth headsets for phone calls and streaming applications such as audio streaming and file transfers. By contrast, BLE is a low power version of Bluetooth, meant for power sensors and accessories where low power consumption is more important than fast throughput and continuous connections. Like Bluetooth Classic, BLE allows devices to communicate with one another and is meant for a range of internet-enabled devices.
BLE was not meant to replace Bluetooth Classic, but rather, to serve as a way for Bluetooth devices to communicate quickly and easily with connected devices in the ever-growing Internet of Things.
The main benefit of BLE is that, as a low-power technology, it can communicate with nearby devices that must, by design, consume less power. These devices include wearables such as heart rate monitors and fitness devices, which typically must run on batteries for long periods and therefore cannot use a lot of energy.
BLE achieves its ultra-low power consumption by “turning the radio off” as much as possible and sending small amounts of data at slower transfer speeds. Compared to Bluetooth Classic, BLE connections are also much faster, as discovery occurs on only three channels, whereas Bluetooth Classic has a time- and power-consuming 32-channel discovery process.
The efficient and low-power nature of BLE, along with its ubiquity in the smartphone market and low-cost BLE modules and chipsets, make it indispensable for connected medical device applications.
Bluetooth 5.0 was introduced in July 2016 and is currently the latest version of the short-range wireless connectivity standard. Official specifications for Bluetooth 5.0 state that “Bluetooth 5 brings some major advances to [Bluetooth Low Energy] and makes it ideal for an even broader range of IoT scenarios … [Bluetooth 5.0] will have a substantial impact in many sectors and further position it as the low power wireless technology of choice in the Internet of Things”.
Bluetooth 5.0 offers a number of improvements on Bluetooth 4.2, and in particular, major updates to BLE (Table 7).
| Feature | Bluetooth 4.2 | Bluetooth 5.0 |
|---|---|---|
| Speed | Supports up to 1 Mbps | 2x data rate, supports up to 2 Mbps |
| Range | 200 meters outdoors, 10 meters indoors | outdoors, 40 meters indoors |
| Message Capacity | 31 bytes | 255 bytes |
| Robustness to Operate in Congested Environments | Lower - in 2.4 GHz spectrum with no code hoping | Higher - uses code hopping in @.4 GHz spectrum |
| Power Requirement | Higher | Lower |
Table 7. Bluetooth 4.2 versus Bluetooth 5.0. (Source: Amar InfoTech)
Bluetooth 5.0 Support Across Devices
It’s important to highlight that not all smartphone models and OS variants that support Bluetooth 5.0 include all of the benefits of the new update, particularly on the Android side. These improvements are optional to varying degrees, so hardware manufacturers that support 5.0 may be missing one or more of these new features.
One important new feature in the Bluetooth 5.0 specification is a choice of three physical layers, or PHYs, which configures the physical parameters of the radiofrequency communications between devices; in essence, the PHY is the Bluetooth chipset. To run Bluetooth 5.0, the phone’s PHY must, at minimum, support LE 1M PHY, the chipset used in Bluetooth 4.0. However, there are two more advanced types of PHYs with better capabilities which do not have to be used in Bluetooth 5.0 smartphones.
The second type of PHY, the LE 2M PHY, is faster, and the LE Coded PHY provides about four times the range of Bluetooth 4.2 without increasing power usage. However, while most new smartphones on the market support either LE 2M PHY and LE Coded PHY, most do not support both.
A second new feature in Bluetooth 5.0 is the use of longer “advertising” packets. In the Bluetooth context, advertising refers to a device’s ability to broadcast a signal to identify itself to other Bluetooth devices. The so-called Bluetooth “advertising” is essential so that the device can locate and link up with other devices. With a longer advertising packet, more information can be transmitted between the connecting devices, which serves to improve the user experience.
However, longer advertising is not required for all Bluetooth 5.0 devices, nor is it supported by devices that only run Bluetooth 4.2. This means that even if newer Bluetooth 5.0 smartphones support longer advertising lengths, older smartphones running Bluetooth 4.2 will not be able to communicate with them, causing compatibility problems between different generations and hardware models/variants of smartphones.
In short, three of the features available in Bluetooth 5 (LE 2M PHY, LE Coded PHY, and extended advertising) do not have to be supported for the device to be classified as Bluetooth 5.0.
Consequently, when a smartphone manufacturer says its hardware model supports Bluetooth 5.0, there may be limitations that prevent it from interfacing with other devices that have support for all of the new features of Bluetooth 5.0.
Unfortunately, this also means that many devices classified as Bluetooth 5.0 will not have all Bluetooth 5.0 features. For example, the Samsung Galaxy S9+ only supports the PHY 2M Layer, while Galaxy S10+ supports all three. This is why it is important to determine whether a device has support for the new Bluetooth 5.0 features before designing a Bluetooth-enabled SaMD product. As noted above, many flagship smartphone models are missing some of the new Bluetooth 5.0 features.
Bluetooth 5.0 and Apple Smartphones
Starting in Q1 2016, over 20% of iPhone hardware models supported Bluetooth 4.2. The iPhone 6 was the first Apple smartphone model to support Bluetooth 4.2, followed by the iPhone 7, 7 Plus, and SE. Q4 2017 saw the introduction of Bluetooth 5.0, which is supported by the newer iPhones, including the iPhone 8, 8 Plus, X, XR, XS, XS Max, 11, 11 Pro, 11 Pro Max, and the just-released iPhone 12 models.
In Q1 2021, 99.4% of Apple iPhone hardware among North America’s subscriber base supported Bluetooth 4.2 and up, while 72.88% of phones supported Bluetooth 5.0 or higher. This data indicates that the vast majority of iPhone models used in North America meet both Bluetooth 4.2 and 5.0 standards and that over 70% of iPhones are Bluetooth 5.0 compatible.
Bluetooth and Apple iOS
Apple’s iOS 14 launch in September 2020 offered new Bluetooth BLE functionality. The iOS 14 software introduced support for Bluetooth Basic Rate / Enhanced Data Rate (BR/EDR) devices. BR/EDR is generally used for short-range, continuous wireless connections, which is why it’s ideal for IoT devices, such as connected medical devices. iOS 14 also ushered in Apple’s emphasis on greater security and privacy. Furthermore, the changes in the new iOS made it easier for developers to use the Bluetooth Application Programming Interface (API).
However, with any new iOS upgrade, there would be issues. We have heard reports on some issues related to Bluetooth connectivity by users when they update their iPhones to iOS 14. This article takes a deeper into the issues that arise with iOS 14.
Bluetooth 5.0 and Android Smartphones
Samsung Galaxy S7 was the first of Samsung’s flagship line of Galaxy smartphones to offer Bluetooth 4.2, while the S8 was the first of the company’s Galaxy line of smartphones (as well as one of the first phones on the market) to offer Bluetooth 5.0. As mentioned earlier, however, Samsung has been inconsistent in the implementation of Bluetooth 5.0 specification options across its hardware models.
Bluetooth 5.0 and the Android OS
In addition to a lack of hardware support, several older versions of the Android operating system do not offer full software compatibility with Bluetooth 5.0. At the present moment, Android versions 8 and above currently support both Bluetooth 4.2 and Bluetooth 5.0 (although not necessarily across all three domains).
Smartphone Compatibility Certification Trends
With the rapid pace of innovation and potential benefits and risks to the public health, the FDA updated their guidelines in 2019 to require a platform (smartphone/OS) compatibility testing strategy from connected device vendors whose mobile apps have higher patient risks. The FDA refers to software functions that are device functions “device software functions” which can include Software as a Medical Device (SaMD) and Software in a Medical Device (SiMD). A number of vendors with device solutions publish their smartphone/OS compatibility certifications on their website. We selected 10 leading connected medical devices and SaMD products for our analysis of the overall competitive trends in the connected medical device space. The companies chosen had all made their device-level compatibility information available publicly via their respective websites.
Of the 10 medical device apps included in our analysis (listed in Appendix A of this report), 8 support Apple’s most recent smartphones (which run on Bluetooth 5.0).
Samsung is supported by a majority of connected device apps, followed by Google and LG. Only four versions of Motorola smartphones were supported by a single app, making the brand the least covered by connected device applications.
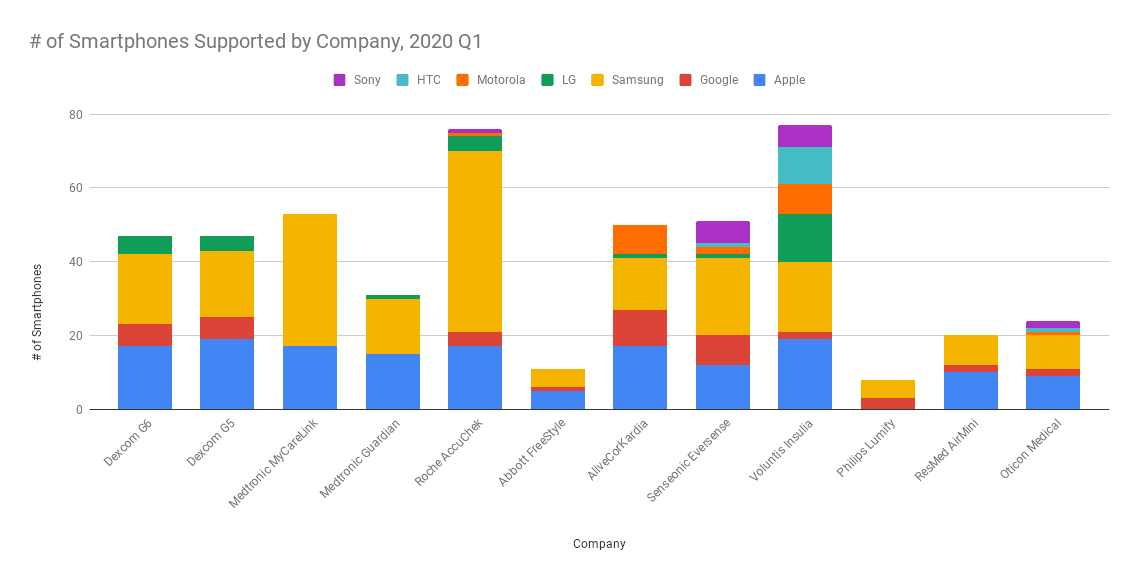
Chart 21. Number of smartphones supported by chosen companies in Q1 2021 (Source: Websites of smartphone manufacturer’s)
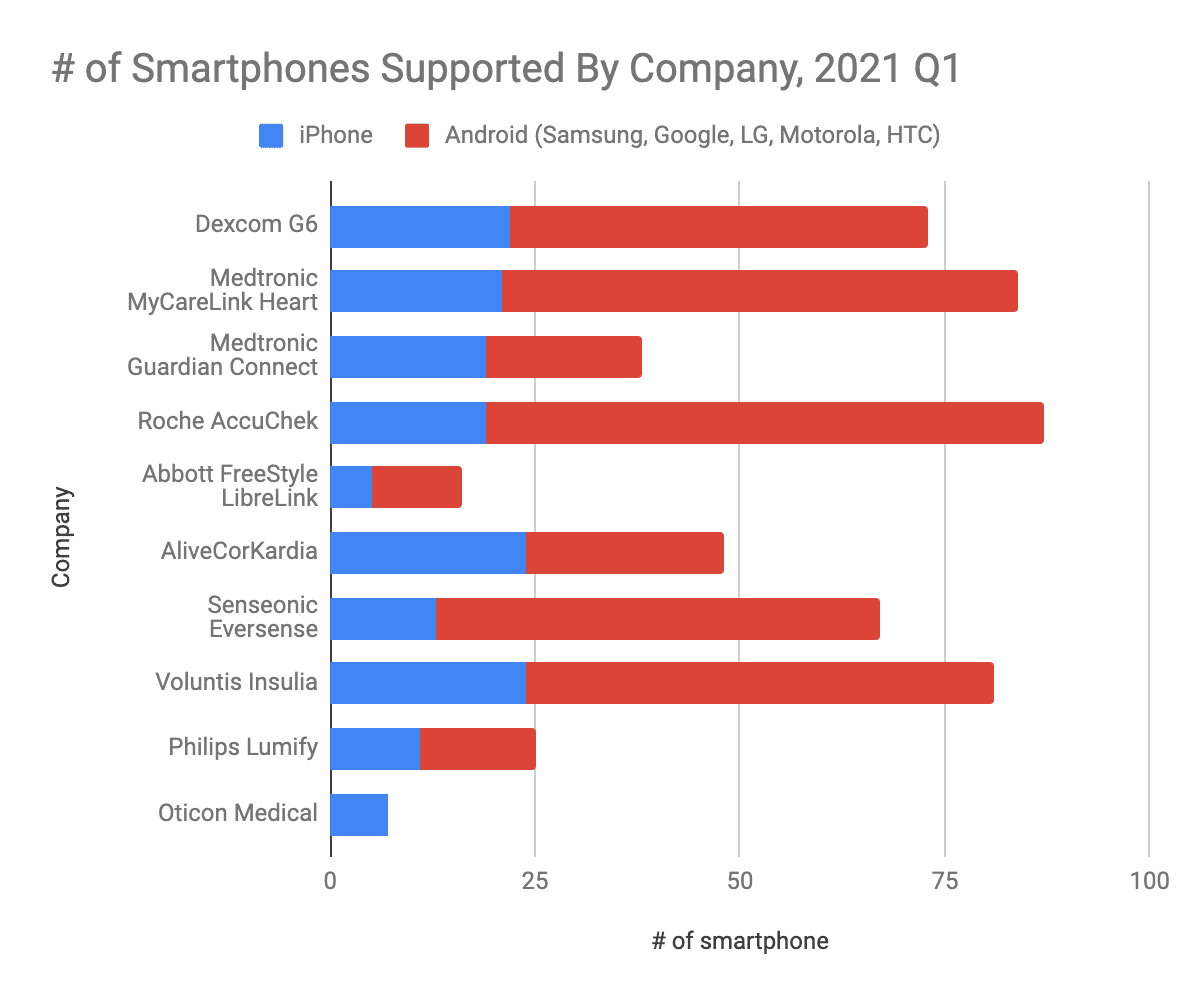
Chart 22. Number of smartphones supported by chosen companies in Q1 2021. (Source: Websites of medical device manufacturers)
These patterns seem to reflect the smartphone brands’ strength on the market, indicating that software developers have done their research regarding subscriber base share and primarily target Apple devices, as well as various models of Samsung smartphone hardware, which runs the Android OS. Interestingly, it appears that some manufacturers, such as Abbott and Voluntis, have yet to update their software for newer Samsung models, potentially indicating that an app may have been, or is in the process of being, discontinued.
So, what determines which OSes and devices are supported?
In general, companies primarily support the most recent versions of the iOS, unless their product has been around long enough that they still have some users with older smartphone versions. This reflects the faster/semi-forced update path for iOS. Companies tend to go back further on versions of Android, due to greater fragmentation from reduced update availability/forced updates.
For smartphone hardware, most have fairly wide coverage on the iOS device side (iPhones, and where applicable, iPads), but have far less coverage on the Android side. The best coverage on the Android side is for Samsung phones (which still have far less coverage, on average, than iPhones), followed by Google and LG.
Finally, some developers of connected devices and SaMD products have a smartphone platform compatibility certification program, which in some cases this is mandated by the FDA. The details of their certification programs are published on their website. This typically includes both operating system versions and smartphone model numbers.
COVID-19
COVID-19 impacted every market sector in the global economy, including the smartphone industry. As people were forced to entertain themselves at home, consumers change how they use their phones. People are spending more time on social media and smartphones have become more of an asset than ever before. Video calling has become the new normal as people try to stay in touch with family, friends, and coworkers; and video watching has increased as people find ways to stay occupied. Consumers are using their mobile phones to get their groceries delivered to practice social distancing requirements. The same is true for contactless payment, where Apple Pay and Android Pay usage have increased as consumers look for the safest and most efficient ways to make purchases.
However, these gains do not represent enough to profit the declining market for new smartphones. In May 2020, the US unemployment rate has reached 14.7%, an all-time high since the Great Depression. With millions of people out of jobs and lacking consistent income, buying a phone (unless needed) may not be consumers’ top priority. The demand for smartphones is decreasing as people conserve money for essentials goods. As the pandemic becomes more controlled and Americans getting vaccinated, it is encouraging to see unemployment rate drop to 6% in April 2021 but still a 2.5% over the 3.5% pre-pandemic unemployment rate in February 2020.
In 2020, the smartphone industry has faced a decline in production. Many factories in China were closed for weeks, including those who produce smartphones. This decline put a strain on global supply chains and sales channels for device makers who have manufacturing factories in China. On top of that, all smartphone manufacturing companies had to close all their stores affecting the demographic who go in-store to make purchases. After a year-long of delays for smartphone production, it is encouraging to see that new shipment data suggests that Chinese smartphone market has recovered to pre-pandemic levels as of March 2021. We expect that smartphone production will continue to grow as people replace old devices.
In one new development, the smartphone industry and governments have worked together on contact-tracing. Government and health authorities are working to find solutions to the COVID-19 pandemic to protect people and get the world back up and running. Software developers are working on tools to combat the virus. Both Google and Apple announced a joint effort to enable the use of Bluetooth technology to help reduce the spread of the virus and both iOS and Android publicly released an update with a contact tracing feature.
This global pandemic is impacting the smartphone industry creating challenges for manufacturers and service providers, but also generating new opportunities as consumers look for ways to conduct work, educate themselves, manage their own health, entertain themselves, and keep in touch with close friends and family. We will need to watch what trends revert, continue or accelerate coming out of the 2020-21 phase of COVID-19.
Apple’s Profitability in Q1 2021
Apple posted an all-time record revenue of $89.6 billion in Q1 2021, up 54% year over the year. Apple’s CFO, Luca Maestri, said that Apple has a strong double-digit growth in each of their product categories, thus driving their installed base of active devices in an all-time high.
Apple also reported a user base of 1.65 billion users across all devices, up from a reported 900 million install base in 2019. This growth was helped by the sales of iPhone 12 models when Apple launched them in Q4 2020.
The largest growth came in Greater China due to China’s 5G infrastructure that is more developed compared to the US. Therefore, more 5G iPhones like the iPhone 12 are sold over there. iPhone continues to make up the majority of sales with $65.5 billion this quarter, although its portion of the total sales has dropped a little from 60% to 58% as the rest of Apple’s lineup sales increased.
Samsung’s Profitability in Q1 2021
Samsung, the world’s largest smartphone make and holder of second place in terms of U.S. subscriber base share, saw its Q1 consolidated revenue at approximately $58.28 billion USD (65.39T KRW), an increase of 6% compared to Q4 2020 and a record for the first quarter. The operating profit increased 4% from the previous quarter due to solid sales from Samsung smartphones and consumer electronics.
In Q2 2021, Samsung predicts a decrease in revenue for the Mobile Communications Business with lower flagship smartphone sales and issues with components experience supply. To minimize the impact from components, the company plans to leverage its global supply chain management capabilities.
Samsung also mentioned that they have plans to popularize their foldable phone models and expand their lineup for mass market 5G phones. It is too early to tell whether smartphone sales will stay strong due to uncertainties over demand related to COVID-19.
Google’s Profitability in Q1 2021
Google’s parent company, Alphabet reported revenue of $55.3 billion in the first quarter of 2021, an increased by 34% from the same period a year ago. While advertising is by far Google’s largest revenue source, accounting for 87% of its overall income, Google’s other revenue which includes Pixel phones, Play Store and non-advertising YouTube revenue came in at $6.5 billion compared to $4.4 billion in the same quarter a year ago. CEO of Google and Alphabet, Sundar Pichai, said that the pandemic has helped Google over the last year as more people have turned to Google Search and online services to stay connected, entertained and informed. Google’s Cloud business has also reported $4.05 billion (compared to $2.78 billion) a year ago.
LG’s Profitability in Q1 2021
LG Mobile Communications division reported $897.18 million (KRW 998.7 billion) in sales in Q1 2021, a 28% decrease compared to Q1 2020. This was due to the lack of new products in light of the public announcement in April 2021 that LG will exit the smartphone business at the end of July 2021.
Motorola’s Profitability in Q4 2020
Motorola Mobility, a subsidiary of Lenovo reported their 2020 end of the year quarterly earnings on February 2021. As of Q4 2020, Lenovo’s Intelligent Devices Group (IDG) which made up of two business units: The PC and Smart Devices Group (PCSD) and Mobile Business Group (MBG) continues to lead the company’s strong performance. MBG recorded a revenue of US$1,521 million, an increase of 10% from the same period last year. Motorola has been successful in driving a mix shift towards higher-end models and expanding average selling prices of their smartphones. The revenue contribution from 5G smartphone models grew 5% to 13% as well as the average selling prices increased 19% year-on-year due to and increased in popularity of Motorola’s premium flagship models.
[maxbutton id=”13″ ]
While this is not a comprehensive list of regulated medical device apps for smartphones, it represents a broad range of device manufacturers.
| Company Mobile App | Mobile App Description |
|---|---|
| Dexcom G6® App | The Dexcom G6 is an FDA-permitted continuous glucose monitoring system that allows you to make diabetes treatment decisions without confirmatory fingersticks or calibration. |
| Dexcom G5® App | The Dexcom G5 Mobile Continuous Glucose Monitoring (CGM) System provides real-time glucose readings for patients with type 1 or type 2 diabetes every five minutes. With Dexcom G5 Mobile, dynamic glucose data can be accessed and shared safely and conveniently anywhere, anytime to your compatible smart device. |
| Medtronic MyCareLink™ Heart App | The Medtronic MyCareLink Heart App is used with Medtronic pacemakers and CRT-P devices with Bluetooth wireless telemetry. The app can be used to automatically send heart device information to your clinic on a scheduled basis or anytime your doctor requests device information from you. The information can be sent wherever you go. |
| Medtronic Guardian™ Connect App | The Medtronic Guardian Connect App pairs with the Guardian Connect Continuous Glucose Monitoring system for people on insulin injections. The app displays sensor glucose data, trends, and alerts in a simple and easy-to-use design. |
| Roche Accu-Chek® Connect App | The Roche Accu-Chek Connect app pairs with the Accu-Chek meter wirelessly via Bluetooth. You can then log results automatically, chart your data, send results to caregivers, and calculate insulin doses. |
| Abbott FreeStyle® LibreLink App | The FreeStyle LibreLink app is used with the FDA-approved FreeStyle Libre 14-day sensors to instantly capture and view real-time glucose levels, assess 8-hour glucose history, and see a directional arrow indicating how glucose is changing. The app also includes a series of in-app reports that visualize trends and patterns to help people understand how well they’re controlling their glucose. |
| AliveCor® KardiaMobile App | The AliveCor KardiaMobile app works with the FDA-cleared KardiaMobile, KardiaMobile 6L, or KardiaBand EKG devices. Touching the sensors on your Kardia EKG device for 30 seconds allows the data to be captured. |
| Senseonics Eversense® App | The Senseonics Eversense app allows you to get your data in real time on your smartphone. The app receives and displays data in easy-to-read charts and graphs. You can discreetly check your info on an Android or iOS smartphone or Apple Watch. New readings are uploaded every five minutes. |
| Voluntis Insulia® App | The Voluntis Insulia app is a prescription-only medical device that recommends basal insulin doses for adults with type 2 diabetes based on the treatment plan created by a healthcare provider. |
| Companion Medical InPen® App | The InPen Mobile app is a diabetes management tool that tracks insulin doses from the InPen, calculates insulin doses, and shares therapy details with healthcare professionals and family members. |
| Philips Lumify App | The Philips Lumify app is paired with the FDA-cleared Philips Lumify, a smart-device diagnostic ultrasound solution. Lumify operates on user-supplied compatible Android smart devices equipped with internet and email functionality. To use Lumify, users download the Lumify App from Google Play, connect their Philips transducer to their compatible smart device via USB, and launch the app to begin scanning. |
| ResMed® AirMini™ App | The ResMed AirMini app enables you to use your AirMini machine right from the palm of your hand. The data is transferred via Bluetooth wireless technology. The app also provides you with a 30-day therapy history and a daily therapy score each morning. |
| Oticon Medical Ponto Trial Companion App | The Oticon Medical Ponto Trial Companion App is an app that helps provide a way for patients to evaluate whether bone-anchored hearing and the Ponto Sound System are the right decision for them. The app guides patients to experience different listening situations and rate their hearing experience. Patients can email their ratings reports directly to their hearing care professional. |
(Source: Smartphone application descriptions from websites of medical device manufacturers)
iOS & Android Devices Subscriber Base
Smartphone Vendor Market Share
Smartphone Introductions
Apple Devices Release Dates & Compatibility
Android Devices Release Dates & Compatibility
Android Manufacturer OS Release Dates
iOS Version Update Dates
Android Version Update Dates
Android Version Distribution Percentage
Android Screen Sizes & Resolution
Peer Analysis
Bernhard Kappe, Founder and CEO
Bernhard is a software development leader, technologist, and pioneer who consistently provides his MedTech clients with an unequaled advantage by helping them develop new digital diagnostic and treatment devices and SaMD-enabled business models that leverage important new trends and techniques at the leading edge of the adoption bell curve (e.g., Agile software development, Lean User Experience, software product management, DevOps, Lean Startup, and open source software). For the last eight years, Bernhard has exclusively focused on the medical device and health tech industry and has worked with clients to create innovative software-based diagnostics and monitoring and therapeutics solutions that are put directly into the hands of engaged patients while shortening product development life cycles, improving delivery predictability, and creating medical devices that are financially and clinically successful.
Bernhard can be reached via:
Email: [email protected]
LinkedIn: https://www.linkedin.com/in/bernhardkappe/
Twitter: @bernhardkappe
Phone: (312) 372-1058 x6002
Randy Horton, VP of Solutions and Partnerships
Randy has spent much of his career working with healthcare and life sciences organizations to tackle the Quadruple Aims: improving the individual experience of care, improving the health of populations, reducing the per capita costs of care, and improving the work life of those who deliver care. With a passion for creative business thinking, nearly three decades of experience with the internet, and a knack for being a connector of people and ideas, Randy helps established organizations break through to their “what’s next” by building new capabilities and launching new digitally-enabled products and services that are both innovative and successful.
Randy can be reached via:
Email: [email protected]
LinkedIn: https://www.linkedin.com/in/randyhorton/
Twitter: @randyhortonchi
Phone: (312) 433-9437
Ke Li Yew, Marketing Associate
Ke Li plays a key role at the intersection of Marketing and Sales. Her work involves conducting market research, analyzing key trends in the medical device and digital health industries, and managing Orthogonal’s online presence and communications.
Yew is currently pursuing her Master of Healthcare Informatics at Harrisburg University of Science & Technology. Previously, she graduated from University of Michigan with an undergraduate degree in Biochemistry. In her spare time, Ke Li enjoys spending time outdoors. A few of her favorite activities are hiking and fishing.
Ke Li can be reached via:
Email: [email protected]
LinkedIn: https://www.linkedin.com/in/ke-li-yew/
Twitter: @keliyew
Phone: (734) 834-2974
Orthogonal is a software developer for Software as a Medical Device (SaMD), digital therapeutics (DTx) and connected medical devices.
We work with change agents who are responsible for digital transformation at medical device and diagnostics manufacturers. These leaders need to accelerate their pipeline of product innovation to modernize patient care and gain a competitive advantage.
Orthogonal applies deep experience in SaMD and the power of fast feedback loops to rapidly develop, successfully launch, and continuously improve connected, compliant products—and we collaborate with our clients to build their own rapid SaMD development engines.
Over the last eight years, we’ve helped a wide variety of firms develop and bring their regulated/connected devices to market.
Almost twenty years ago, we began our consulting work to create great software products in a range of industries, including financial services, education, research, and healthcare. We spent nearly a decade working with leading-edge fast feedback loop techniques that have now become recognized best practices such as Agile software development (with XP, Scrum, and Kanban), Lean User Experience (Lean UX), and Lean Startup.
Nearly a decade ago, we got a glimpse of digital healthcare and the enormous potential of the cloud, IoT, and smartphones, and the potential impact of medical device software. Realizing that’s what we wanted to focus our energies on exclusively, we narrowed our focus to the development of SaMD, DTx and connected medical devices.
We’ve never looked back. Our team gets up every day excited to help move the needle on healthcare. For almost ten years, we’ve helped a wide variety of firms develop and bring their regulated/connected devices to market. We’re even more excited about the next ten years and what we will help accomplish during The Great Acceleration of Digital Health.
If you need help building your next connected device, or to learn more, send us a message or call us at (866) 882-7215.
Related Posts
Article
MedTech Teams Should Stop Paying for Compliance Twice

Article
Beyond the Device: Where MedTech Digital Ecosystems Are Starting to Pay Off

Article
Why MedTech Teams Slow Down as Software Grows and What Better Architecture Looks Like
Article
What Actually Works in MedTech, According to Industry Leaders
